Oman_NGS
Mycobacterium tuberculosis example dataset
Table of contents
1. Introduction
The goal of this exercise is look at basic QC data from Illumina sequencing reads and to use a trimming tool to remove adapter sequences and poor quality bases. Our dataset are two M. tuberculosis samples that have been sequenced via Illumina paired-end. We will be using this data for this module and the next to focus on the basics of data QC and for mapping reads to a reference genome.
We will
- Learn how to run
fastqcon Illumina reads - Use
multiqcto combine and visualize multiplefastqcreports - Learn how to create a new
condaenvironment - Use
trim_galoreto trim Illimina fastq data
First move into the TB dataset folder:
cd TB_module
If you list the contents of this directory ll it should appear like the following:
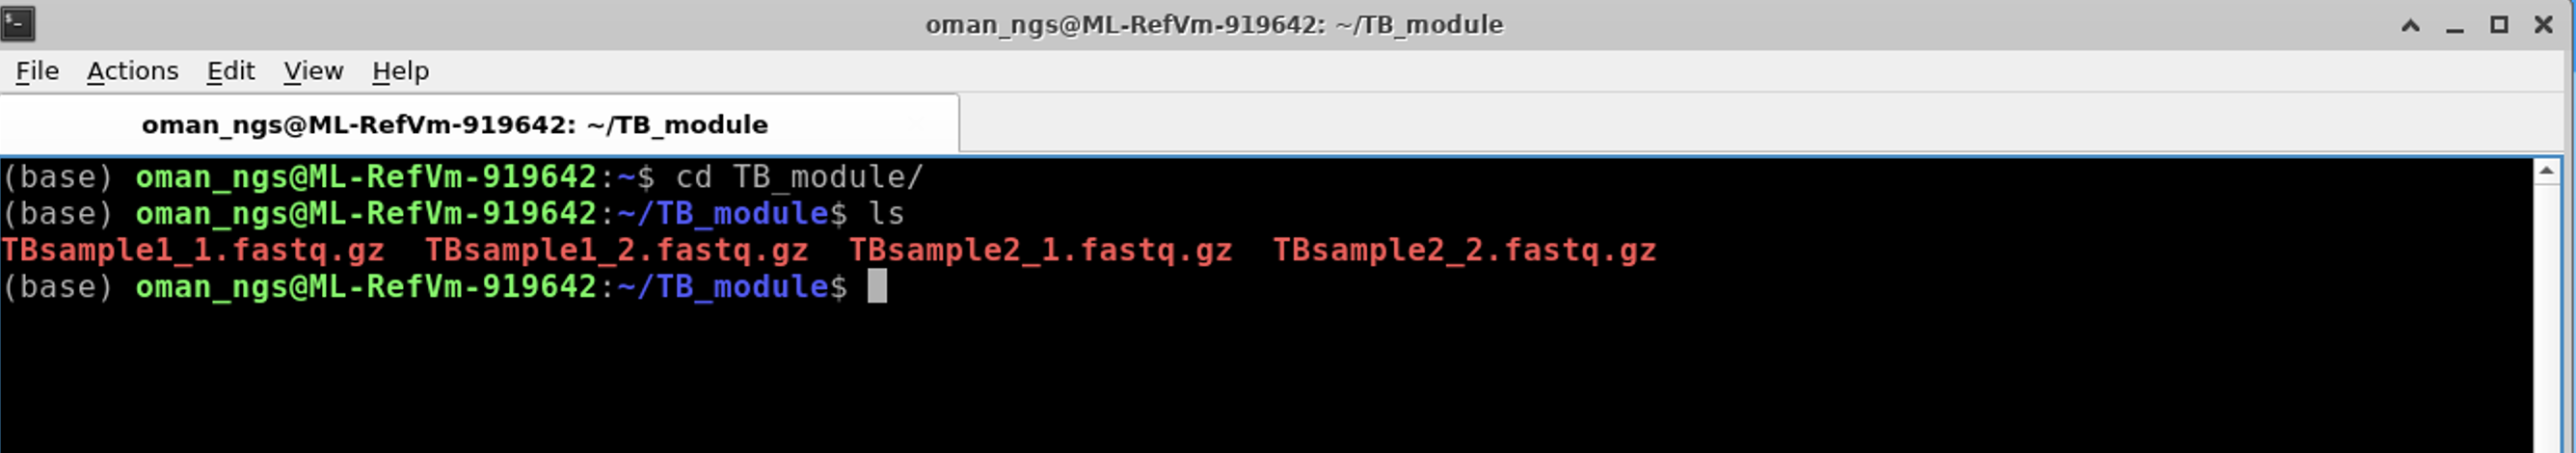
We are working with two samples that have been sequenced with Illumina via paired-end sequencing. Therefore, each sample has a forward and reverse read. The forward read is usually denoted by SAMPLE-NAME_1.fastq.gz and the reverse is usually denoted by SAMPLE-NAME_2.fastq.gz
Run FASTQC
The program fastqc is widely used to assess the quality metrics of Illumina sequencing data. Here we will be running fastqc on both of the TB samples before and after we perform read and adapter trimming.
As with nearly all programs you can get see how to run the program by either just typing the program name, in this case fastqc or typing fastqc -h.
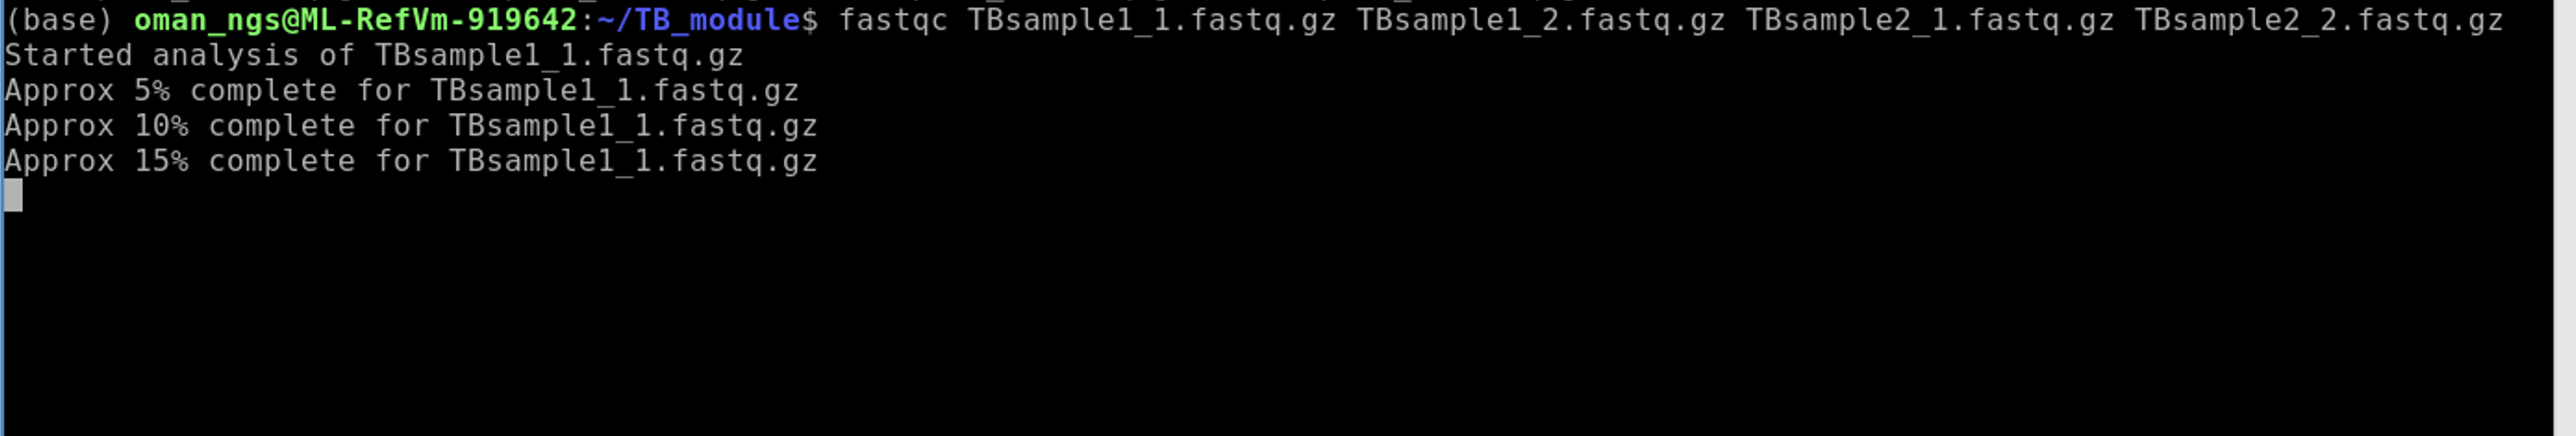
fastqc in default mode simply expects fastq files after the program name like so : fastqc SAMPLE_1.fastq.gz. We have to run the program for each the forward and the reverse reads per sample – so a total of 4 files. Thankfully we can list all the files at one time.
Run fastqc on each of the files:
fastqc TBsample1_1.fastq.gz TBsample1_2.fastq.gz TBsample2_1.fastq.gz TBsample2_2.fastq.gz
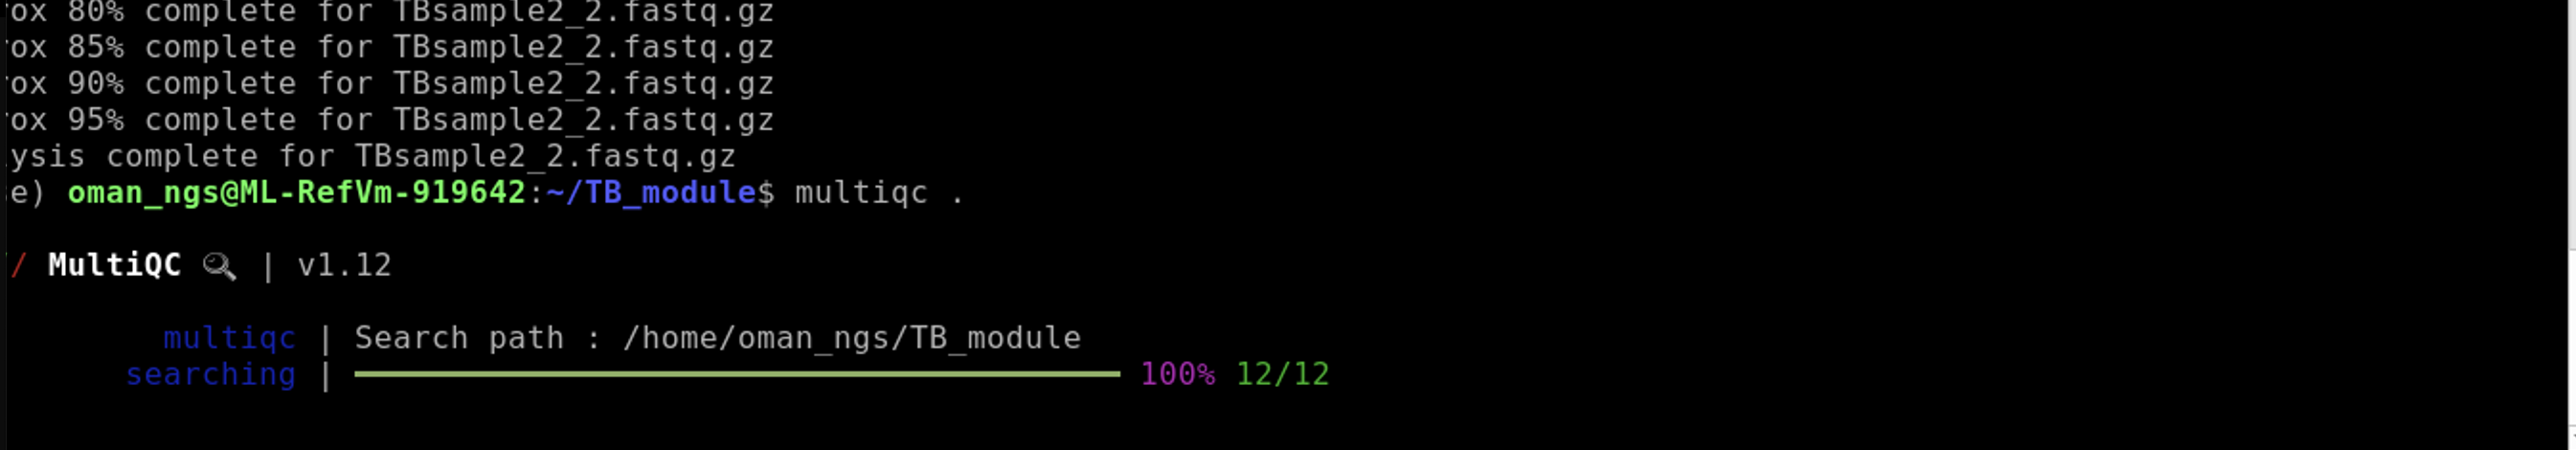
When this has finished, we are now going to use a related program called multiqc to combine and visualize the output of fastqc.
Run multiqc here and don’t forget the period at the end of this command! The period simply designates run “here” in the current folder
multiqc .
Type ls to see all the new files we have generated

| File type | Description |
|---|---|
| .fastq.gz | original fastq data |
| _fastqc.zip | data folder for output of fastqc compressed as zip file |
| _fastqc.html | fastqc results per file that can be viewed in web browser |
| multiqc_data | multiqc combines the data across all fastqc and stores them in this folder |
| multiqc_report.html | results of multiqc that can be viewed in web browser |
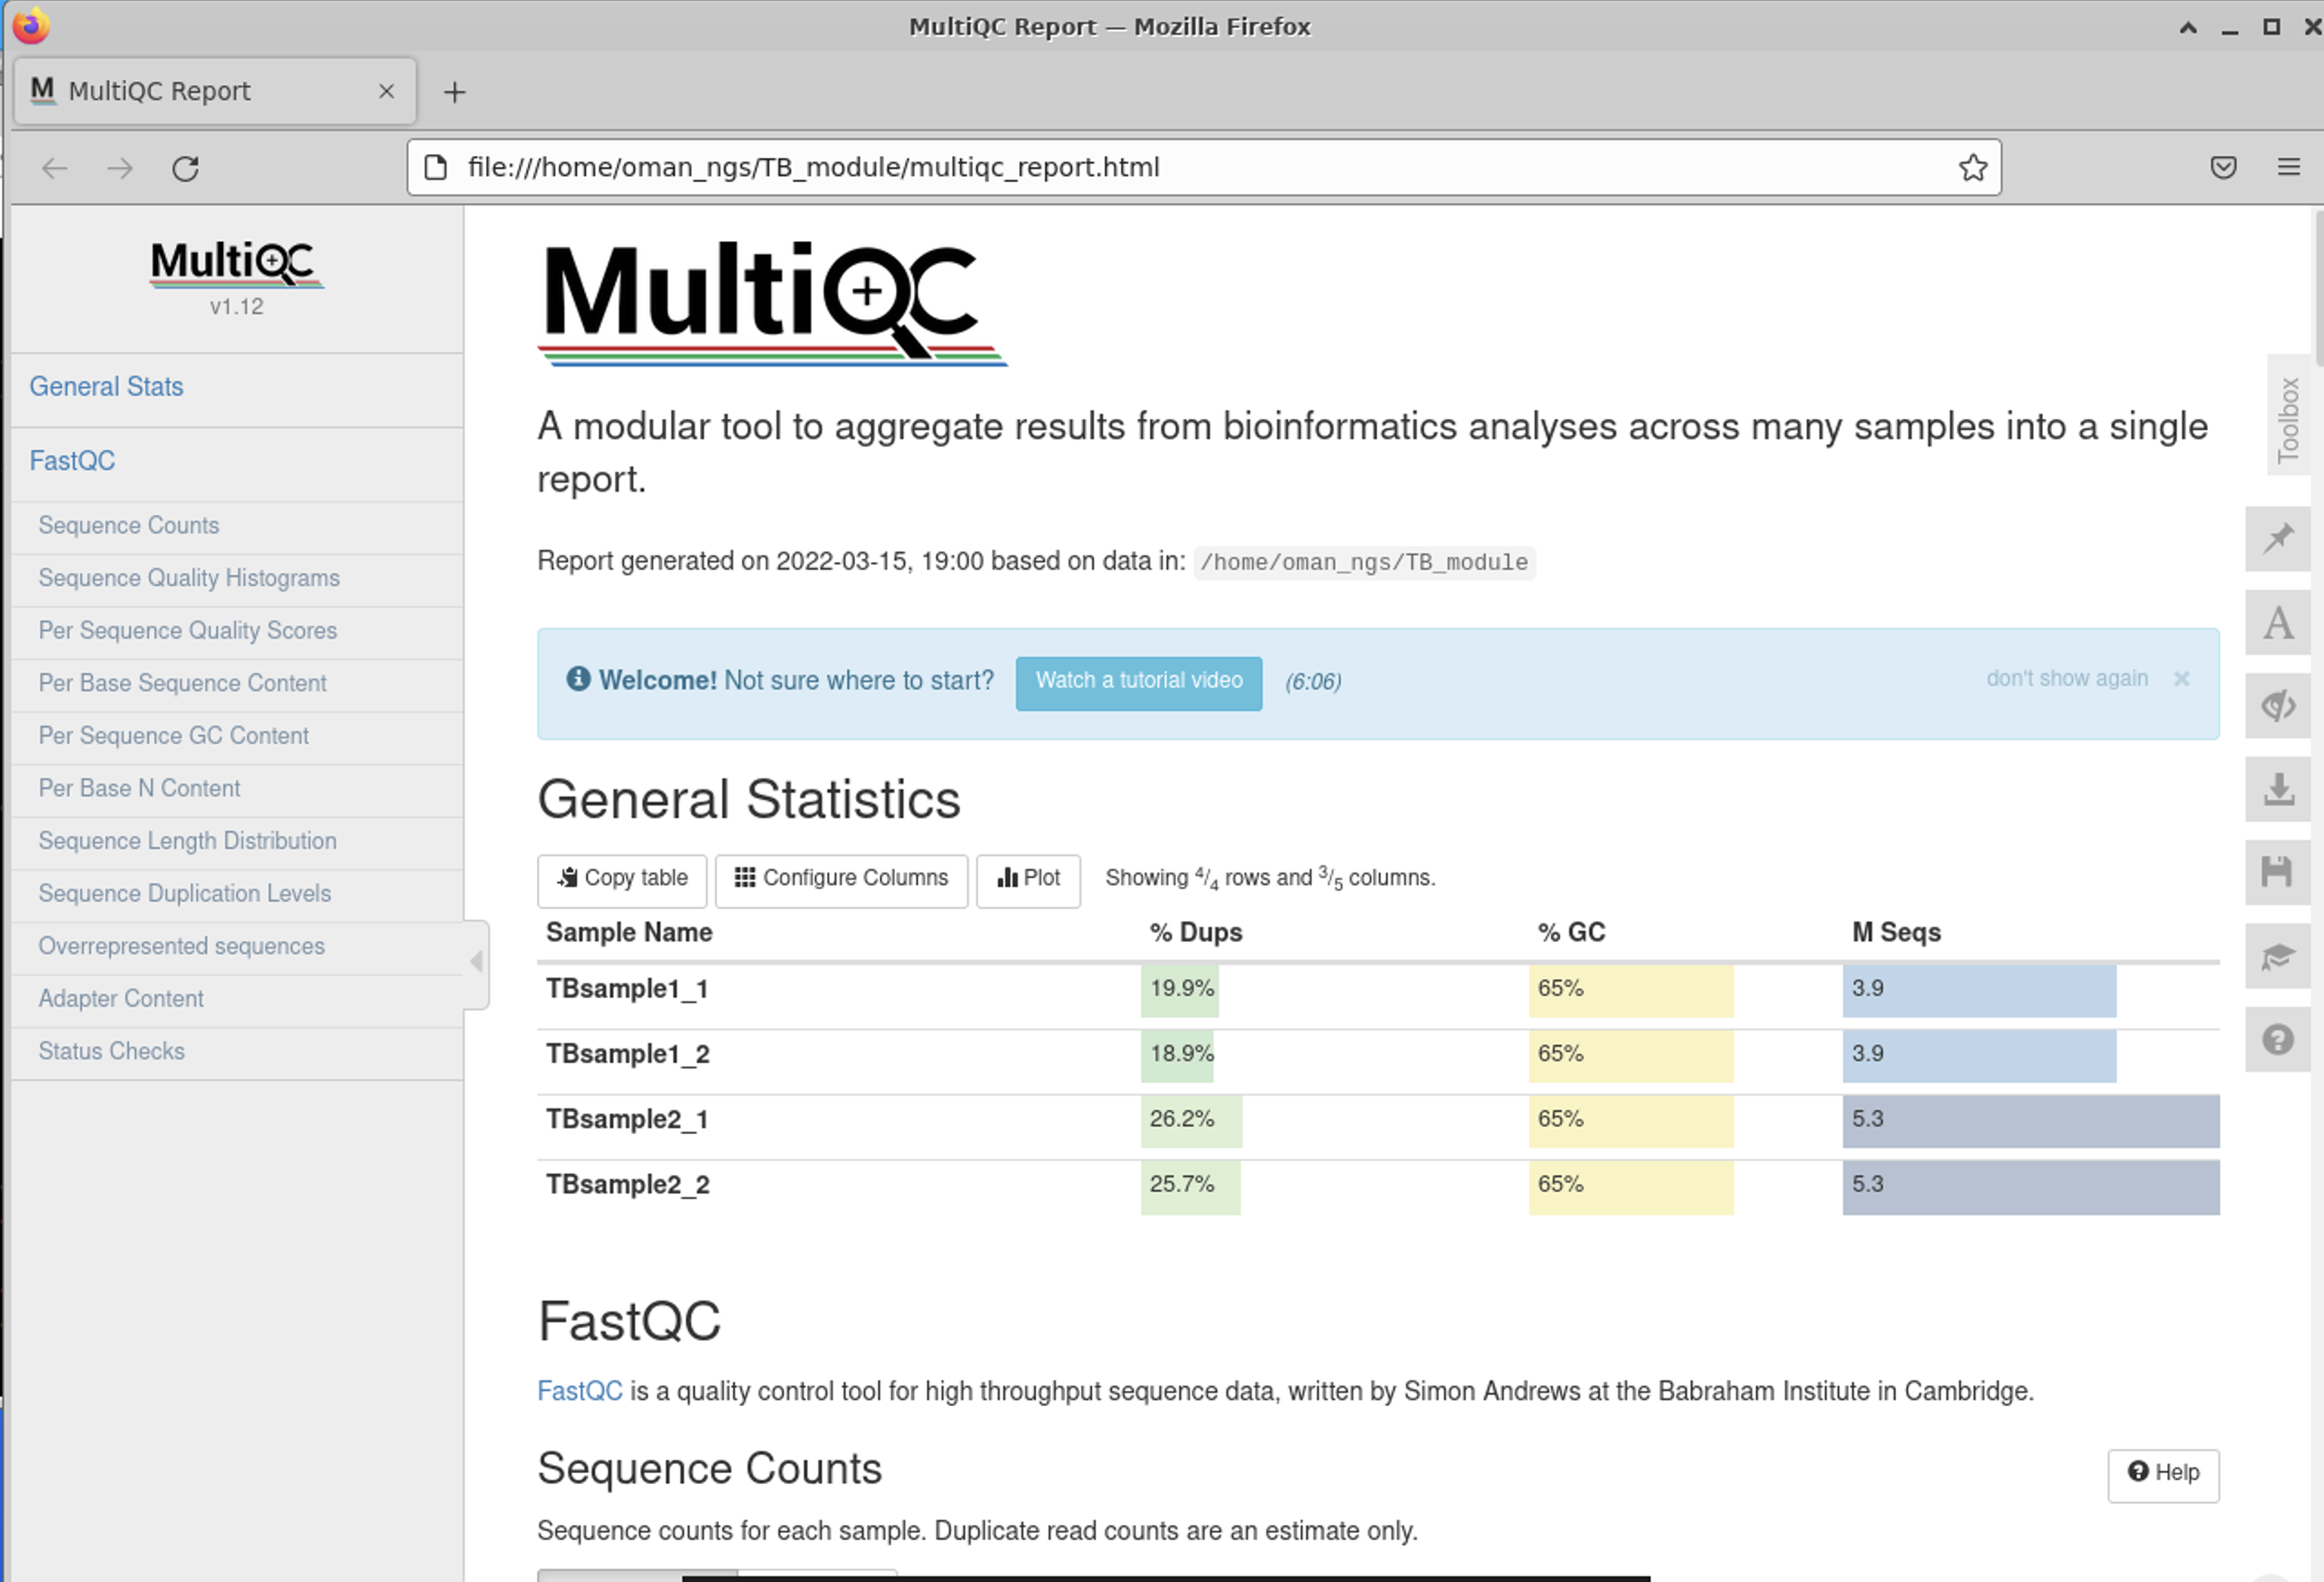
The main output for us to view from multiqc is the multiqc_report.html file. We can either open this file by using the file browser and clicking on the html file, or we can open a web browser from the command line.
To view results type:
firefox multiqc_report.html
This will open firefox and load the file into an interactive session.
There are many different statistics and QC analysis that is output by fastqc / multiqc. Here we are going to highlight the most important ones, but I encourage you to look over all of them and use the nice built-in descriptions to learn more.
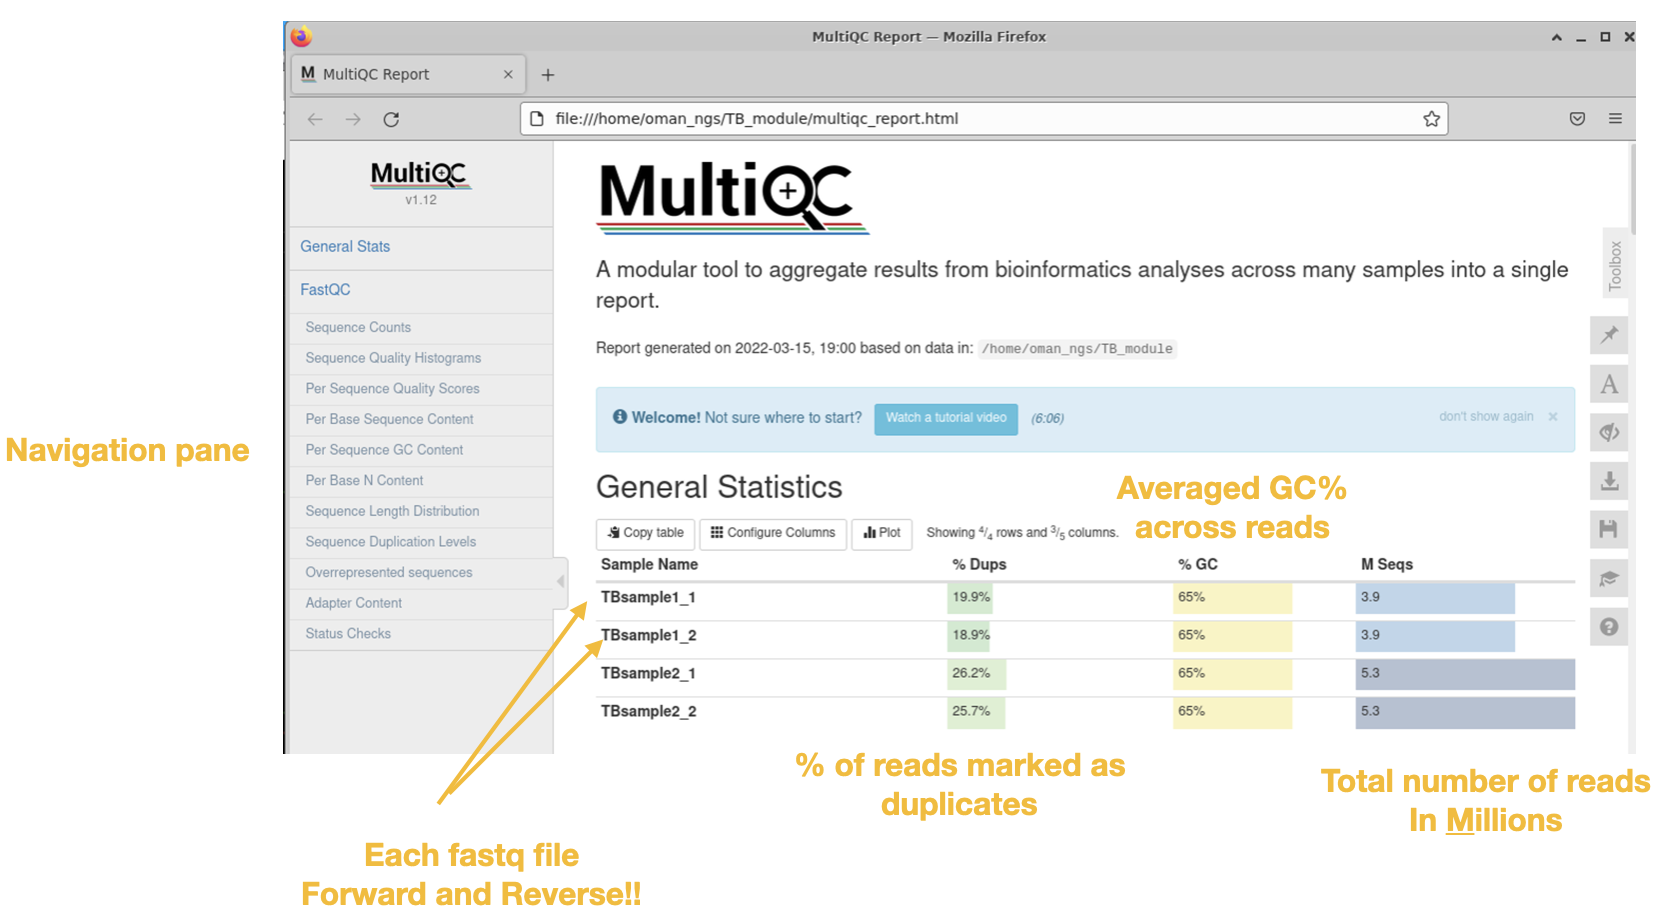
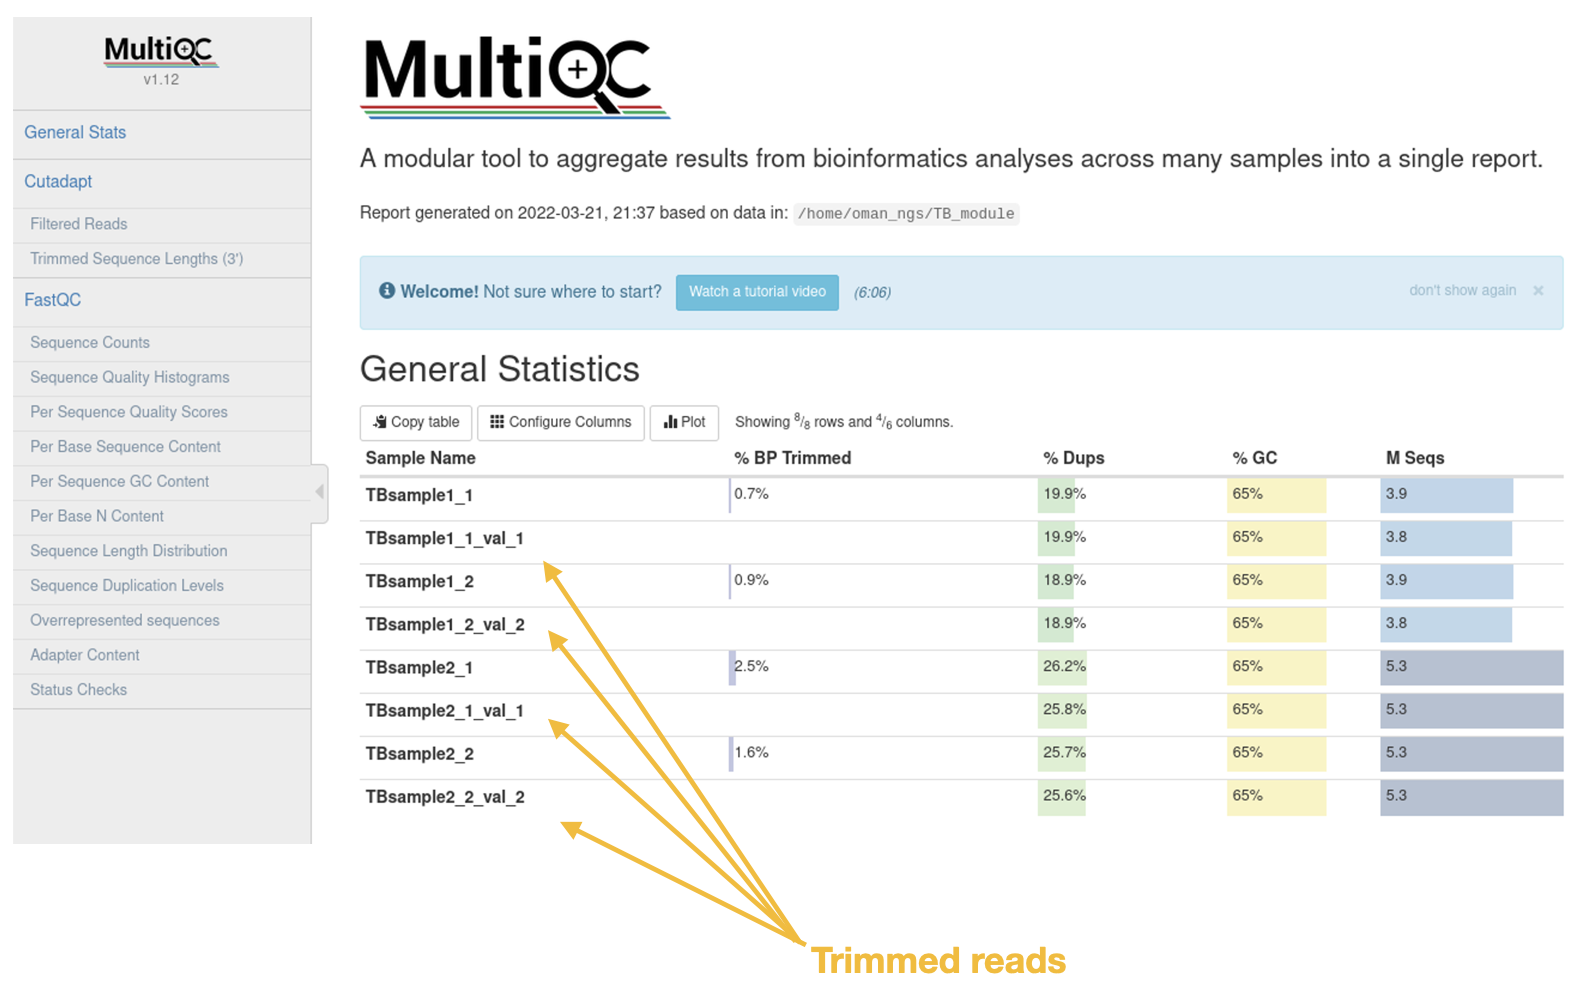
General Statistics Table
The first is the nice General Statistics table at the very start. This is s nice summary per file (remember it is a separate file for both forward and reverse reads per sample)
Sequence quality histograms
This is THE most important plot. This plot shows you the average quality score per base across summarized across the read length.
Sequences with good quality scores across the read are colored green.
Sequences with poor quality scores across the read are colored red.
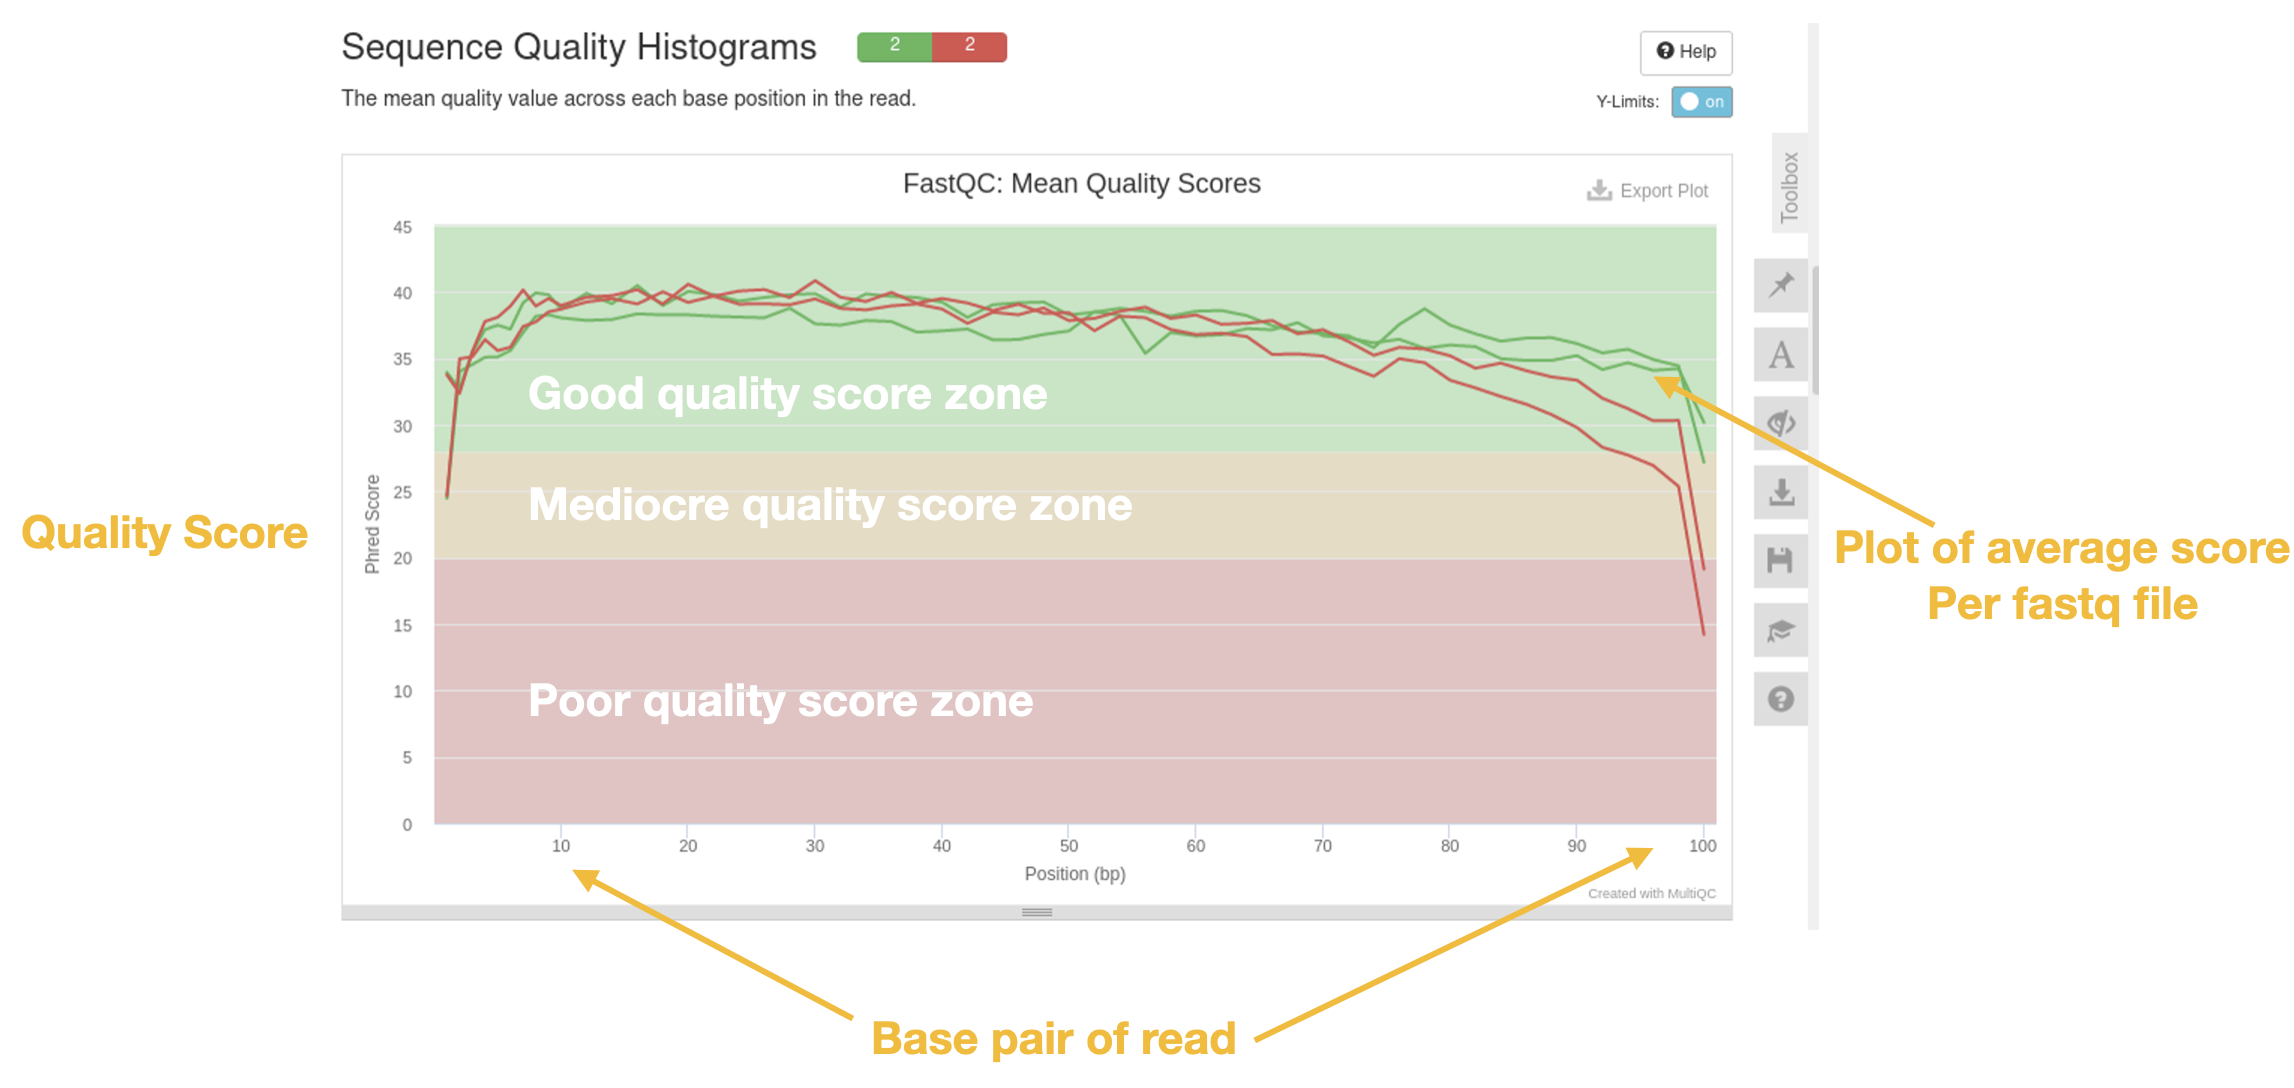
Questions
- Which sample has good quality scores?
- Which sample has bad?
- What is happening at the end of the reads in terms of quality?
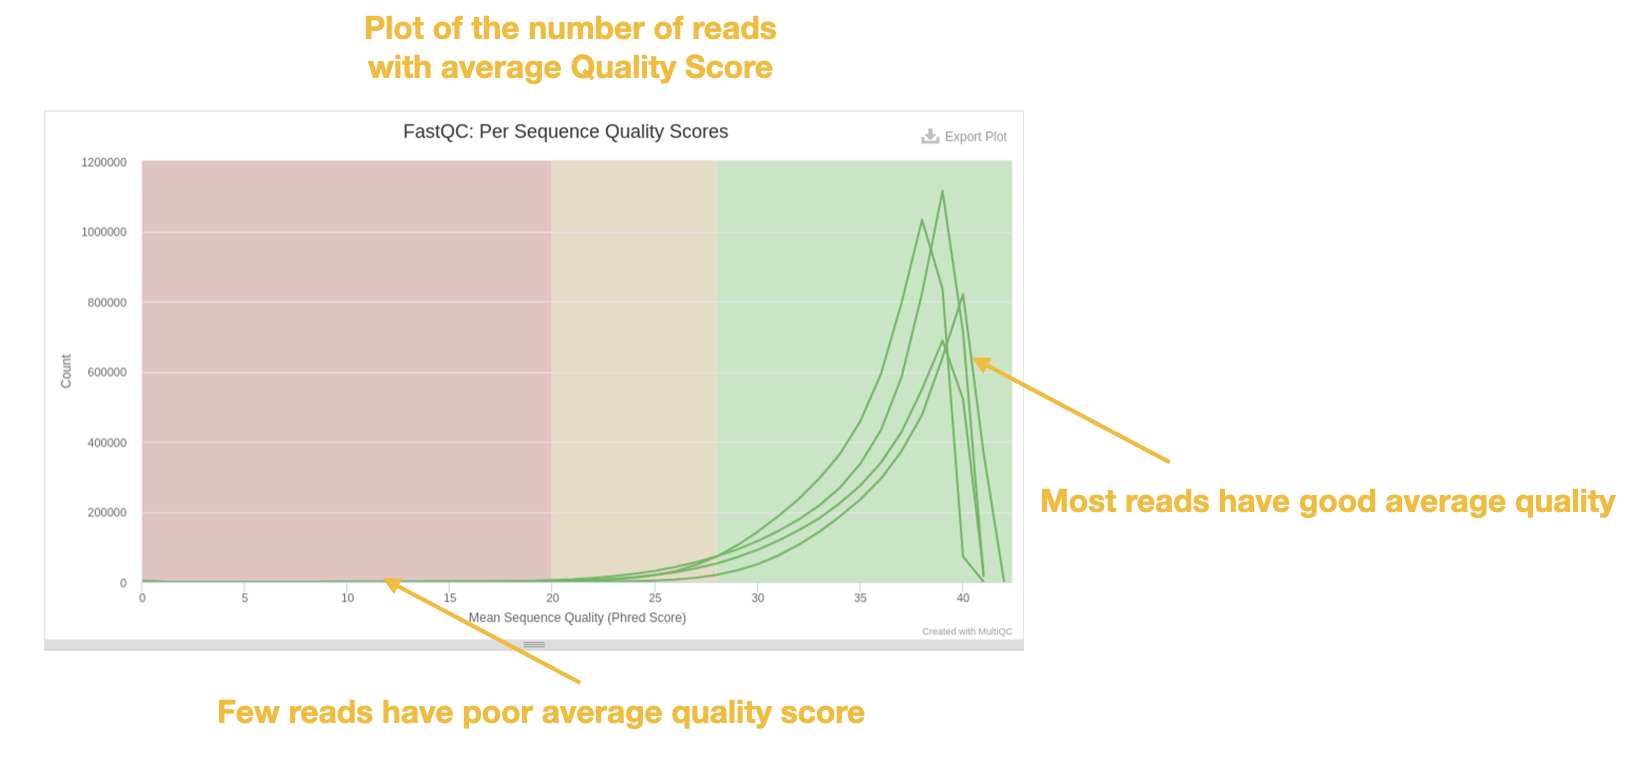
A related plot is the per sequence quality scores histogram which gives the total number of reads that have a given mean quality score.
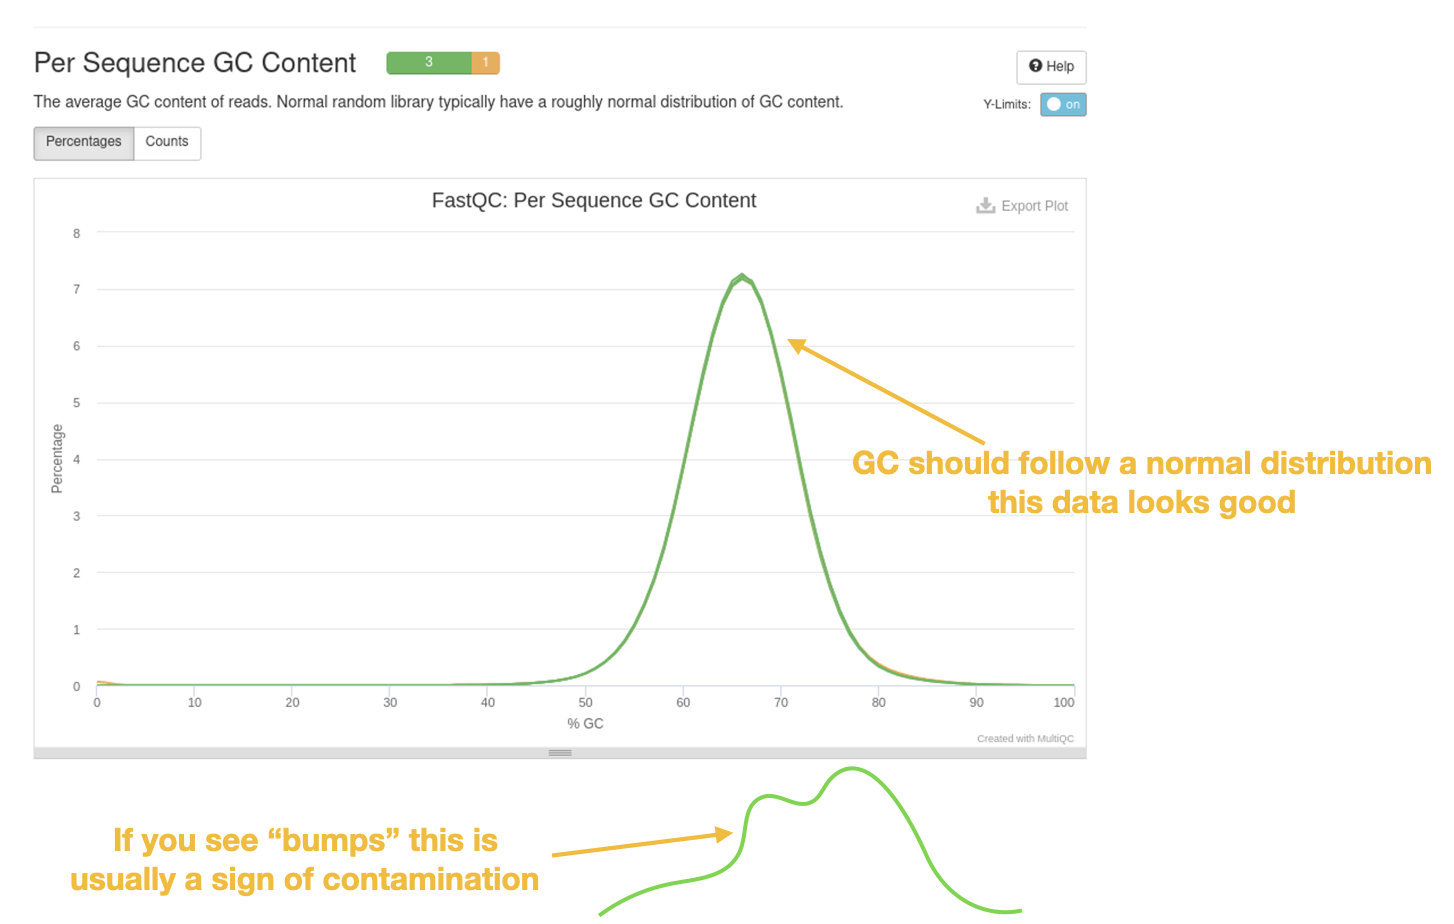
GC histogram
Another important plot is to look at the mean GC content of the reads. This plot often gives us an indication of whether or not we have contamination. If you are sequencing a single organism in your sample(s), the GC content should follow a normal ‘bell’ distribution. If there happened to be contaminating DNA from another organism it will likely have a slightly different mean GC and this shows up a ‘bump’ in the distribution.
There are other useful plots and analyses that are in the fastQC / multiQC report. I encourage you to look at these and explore the data!
Control+c will allow you to close firefox at the terminal when done viewing the report
↥ Back to top ***
Trimming reads with trim_galore
Next, we will be using the tool trim_galore to trim (ie remove) poor quality data and contaminating adapter sequences. trim_galore takes about 10 minutes to finish per dataset.
Trim Galore is a tool that runs the program cutadapt and fastQC. You can find more information about these tools here:
Trim Galore: https://github.com/FelixKrueger/TrimGalore/blob/master/Docs/Trim_Galore_User_Guide.mdcutadapt: https://cutadapt.readthedocs.io/en/stable/
Using conda to install and download tools
First we will use conda to install the trim_galore program. conda is a package management tool that allows one to create different “environments” and takes the pain out of downloading software. I have already installed conda but you can find the details how I did this here : https://docs.conda.io/en/latest/miniconda.html
Please run:
conda create --yes -n qc -c bioconda -c conda-forge python=3.8 trim-galore fastqc multiqc
This creates a new environment called ‘qc’ and installs the programs trim_galore , fastqc, multiqc and python3.8
You activate the new environment with the command:
conda activate qc
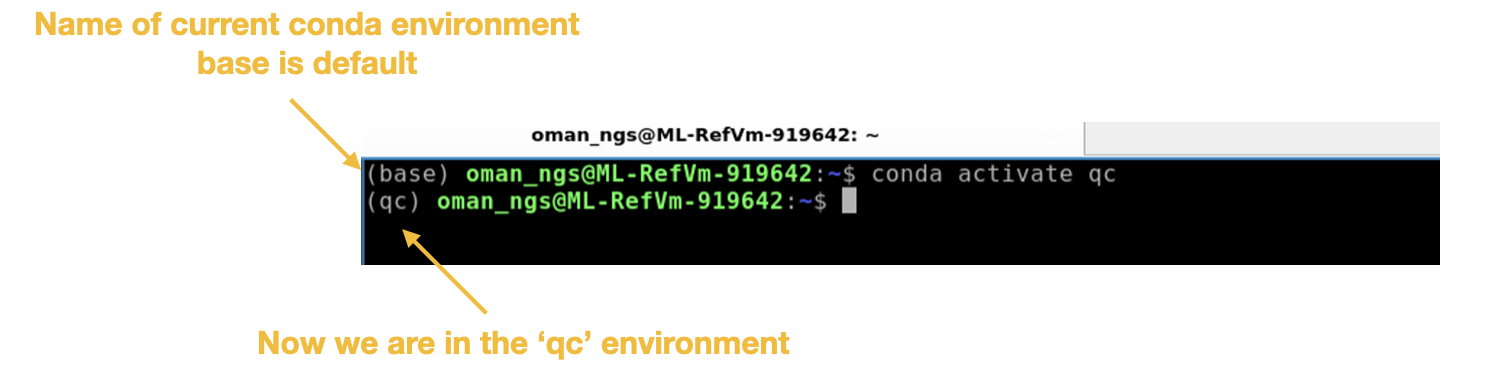
Now we are able to use trim_galore to process the fastq file for each of the TB samples.
Run trim_galore on Sample 1
trim_galore --cores 4 --paired --fastqc TBsample1_1.fastq.gz TBsample1_2.fastq.gz
This command has several options that we used:
--cores 4 : use 4 CPUs (the max on our VMs) so that it runs faster
--paired : let’s the program know we have paired-end data
--fastqc : automatically runs fastQC when finished
!!! This step is going to take around 10 minutes to finish. While waiting please go to Download Reference Genome section.
When finished trim_galore produces the following files per fastq file:
| File type | Description |
|---|---|
_val_1.fq.gz or _val_2.fq.gz |
trimmed fastq file |
| _trimming_report.txt | summary output of trim_galore command |
| _val_1_fastqc.zip | data folder for output of fastqc compressed as zip file |
| _val_1_fastqc.html | fastqc results from trimmed fastq that can be viewed in web browser |
Now run trim_galore for the second sample:
trim_galore --cores 4 --paired --fastqc TBsample2_1.fastq.gz TBsample2_2.fastq.gz
This will take around 10 minutes to complete.
Use this time to look over the fastQC html files or the multiQC html files we have already generated and see if there are any questions.
Once the command above has finished use ls to see all the files we have generated:
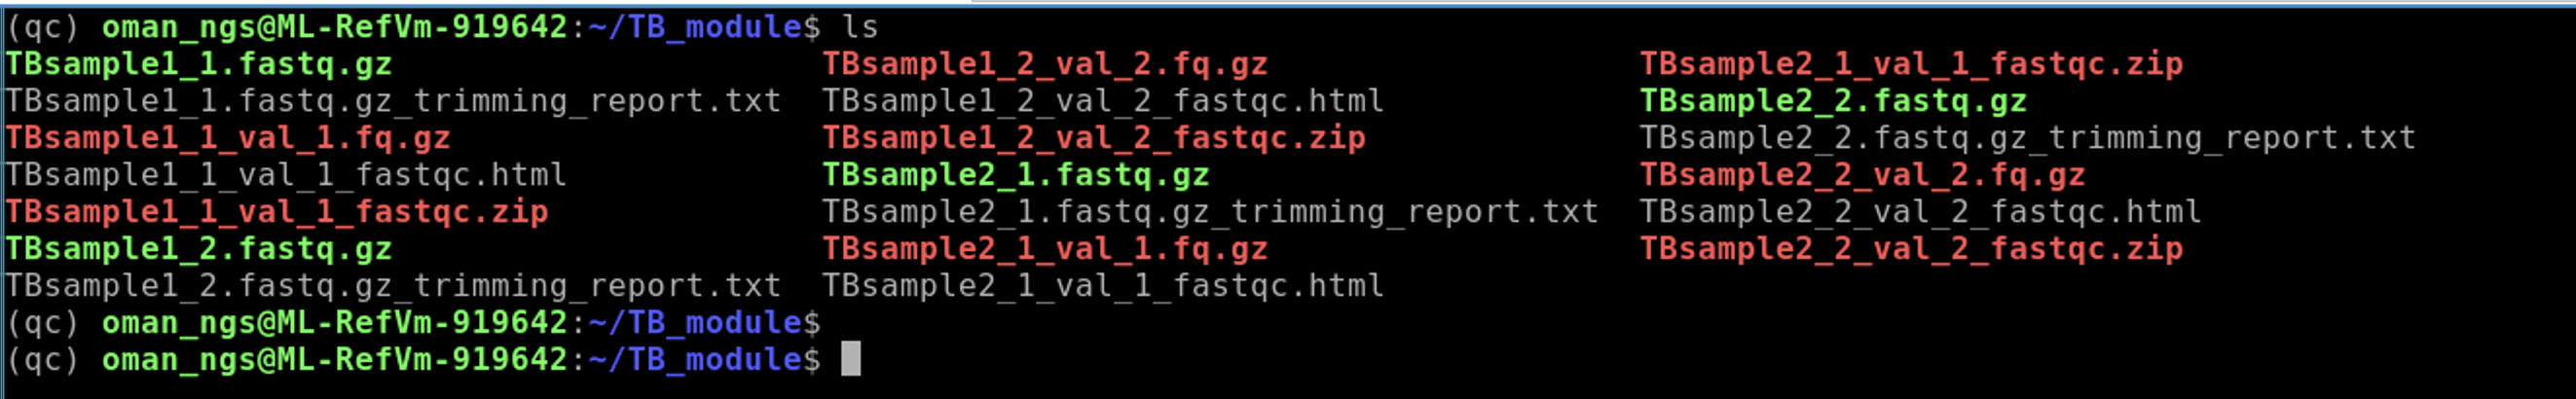
At this point we should have fastQC data for our original fastq files as well as the trimmed reads.
Run multiqc to collate all fastQC reports for original and trimmed reads
multiqc -f .
-f : overwrites the previous multiqc report
Open new report with firefox
firefox multiqc_report.html
Remember Control+c will allow you to close firefox at the terminal when done viewing
Comparing the dataset
Look through the new multiQC report to see the difference trimming has made (particularly for TBSample2 data)
Questions
- Look at the Sequence Count table. Are there less reads in the trimmed datasets compared to the original data?
- Was a large percentage of reads removed or trimmed overall?
- How did trimming effect the mean sequence quality? Does the data look to be higher quality now?
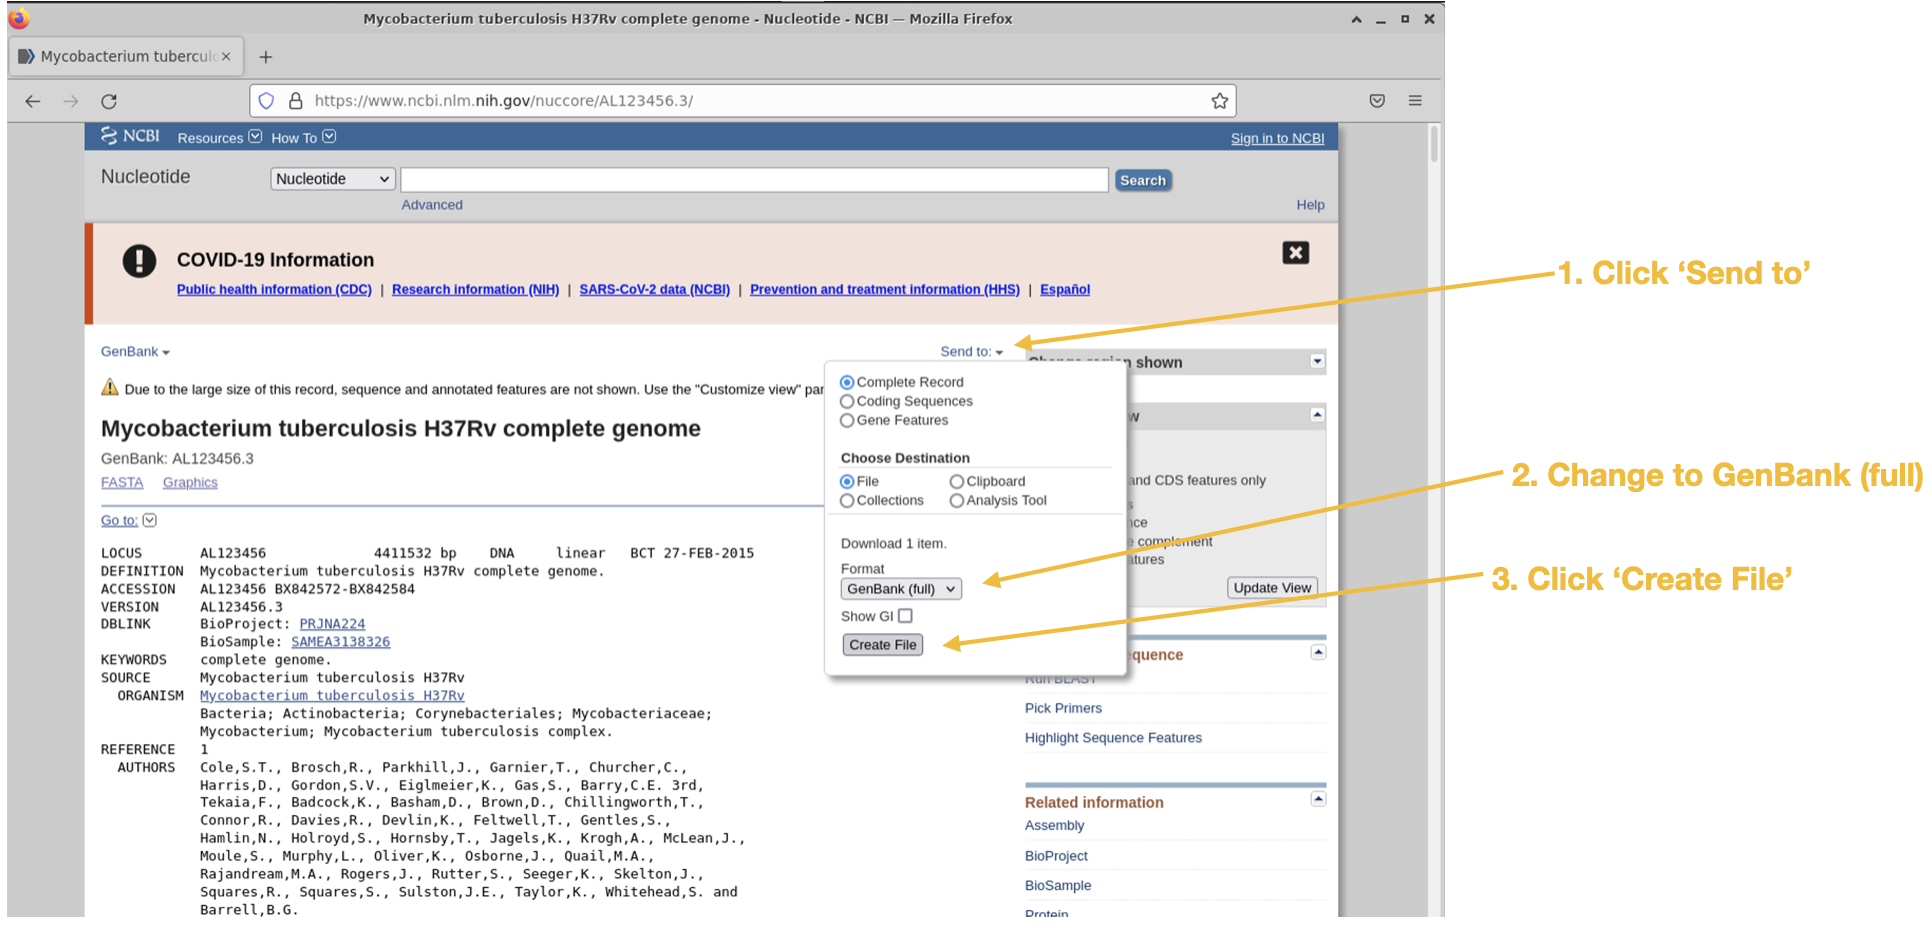
Download TB reference genome
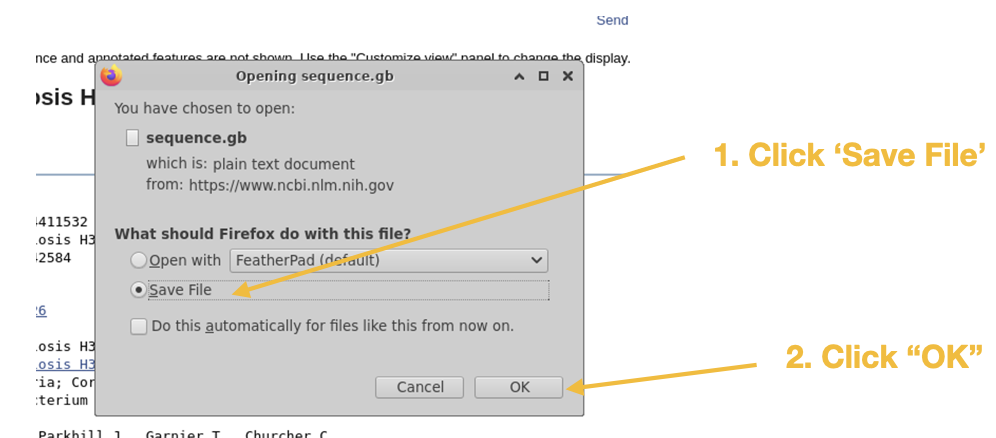
The reference genome Mycobacterium tuberculosis H37Rv can be found here : https://www.ncbi.nlm.nih.gov/nuccore/AL123456.3/
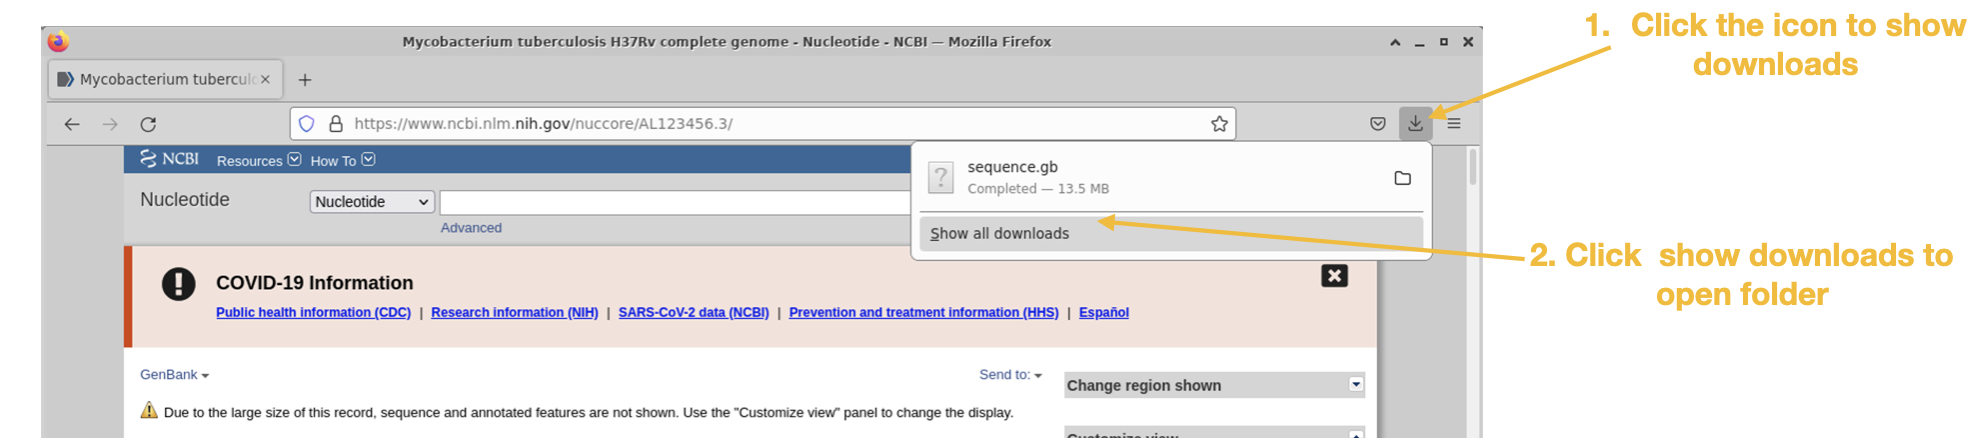
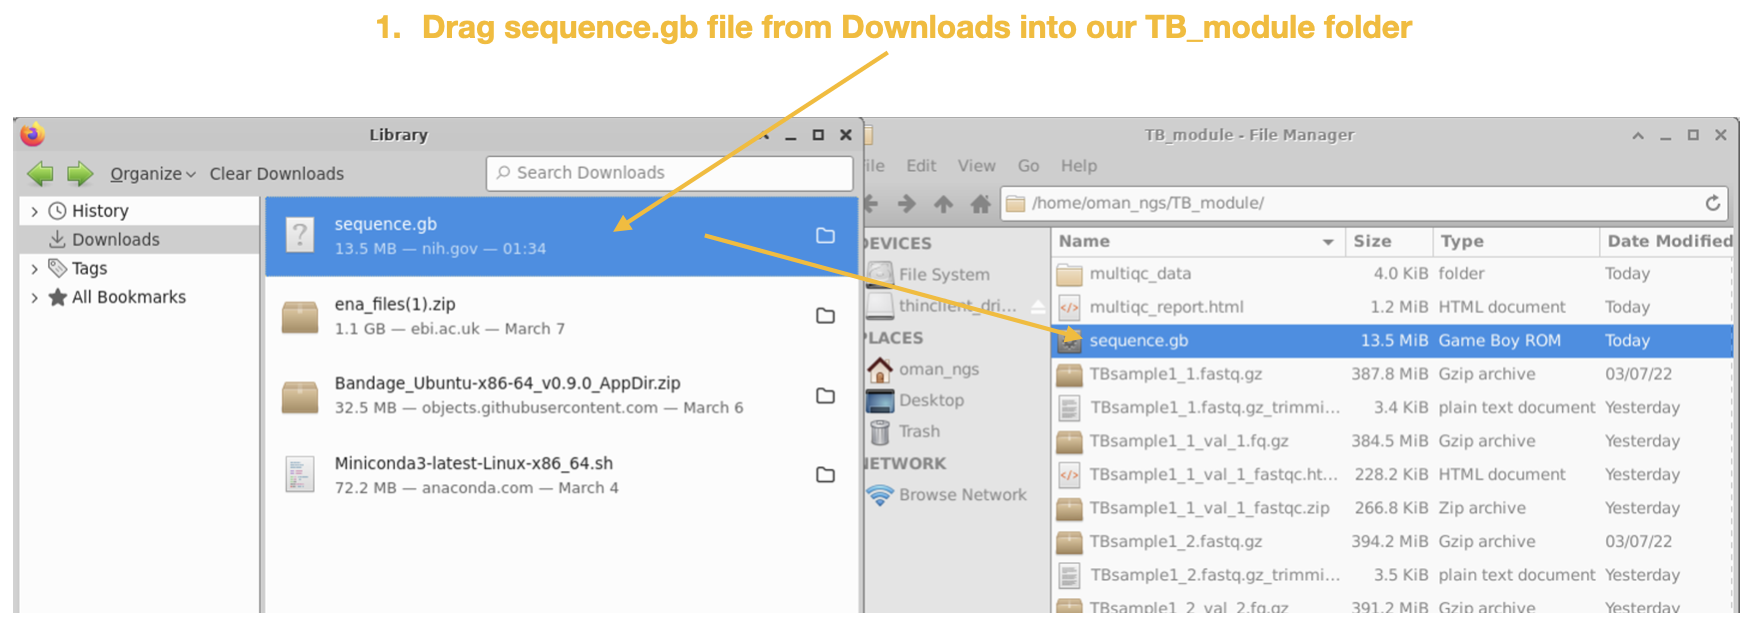
Follow the steps below for downloading the GenBank genome file:
Step 1
Step 2
Step 3
Step 4
Step 5
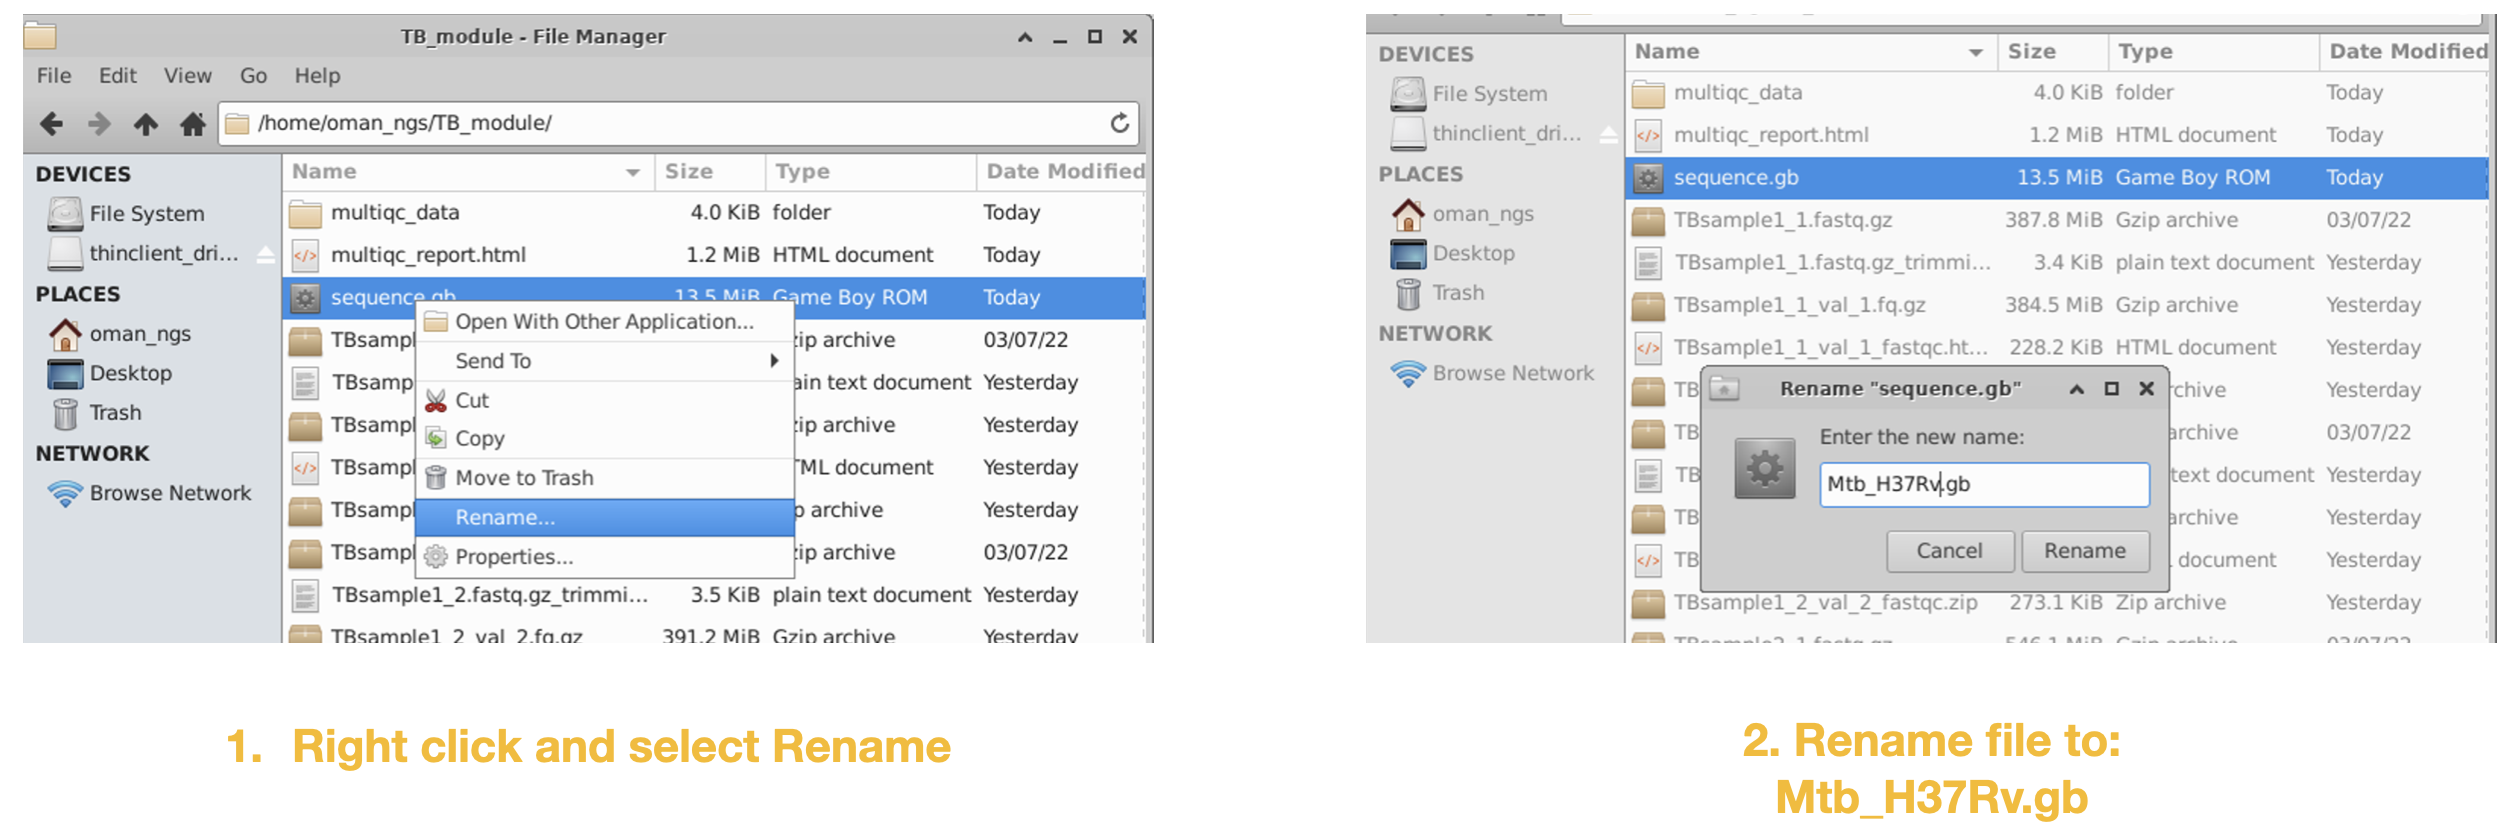
We will be using this reference genome file for our upcoming mapping module.