Oman_NGS
Table of contents
1. Introduction
In this module, we are continuing our SARS-CoV-2 module from last week. This week we will assign Pangolin and NextClade lineages to our sequences. We will also then merge our data with a subset of globally sampled genomes, align these sequences using mafft and then create a phylogeny so that we can identify relationships between isolates.
Navigate to our SARS_CoV-2 folder:
cd Oman_modules
git pull
cd SARS_CoV-2
ls
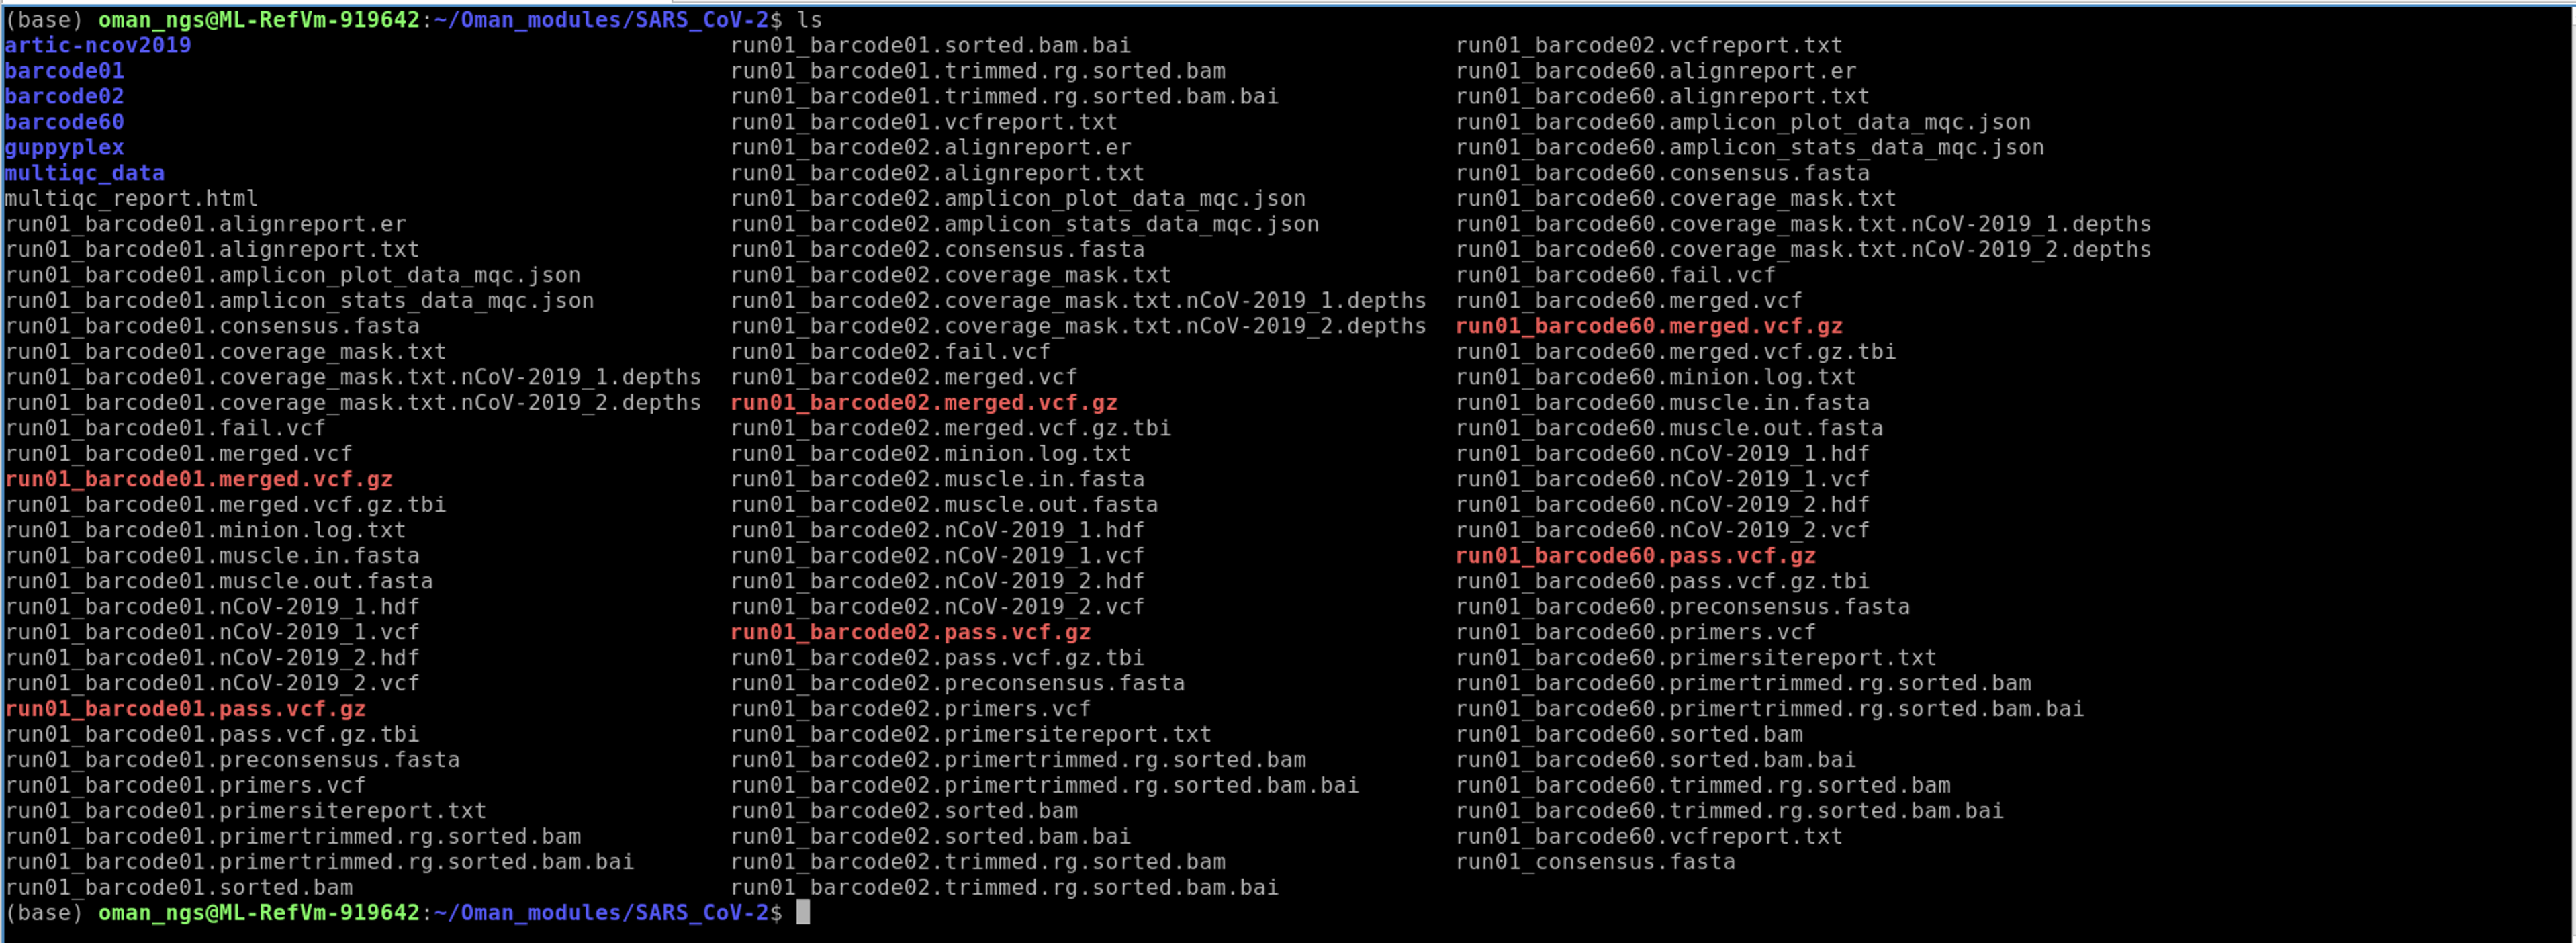
Recall the output files from the ARTIC pipeline we ran last module. We are particularly interested in the consensus genome files produced. You can see those files specifically by using the * trick like so :
ls *.consensus.fasta

Then we can combine these files together using cat:
cat *.consensus.fasta > all.consensus.fasta
We can check how many entries are in a fasta file by using grep
!!! It is very important to remember the ">" in this command !!!
This is because > is the redirect output symbol for creating a new file. If we forget to quotes then we will overwrite our file! ">" versus >!!
grep -c ">" all.consensus.fasta
-c = count the number of matches
Here we are searching for matches to >, which is at the start of every fasta entry

1. Running Pangolin
Pangolin has become the default tool for assigning lineages for SARS-CoV-2. You can learn more about the actual tool from the website:
https://cov-lineages.org/resources/pangolin.html
First we install pangolin using mamba:
mamba create --name pango
conda activate pango
mamba install -c conda-forge -c bioconda -c defaults pangolin
Check that the installation worked:
pangolin -v
pangolin -pv
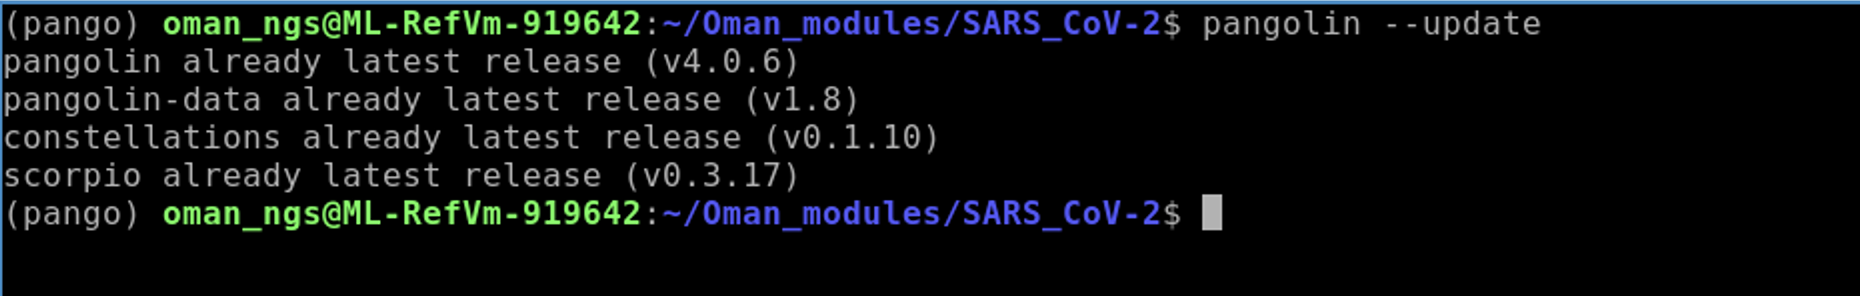
As new lineages and variants arise, pangolin must be updated regularly. To update run:
pangolin --update
Run pangolin on our consensus genomes:
pangolin all.consensus.fasta
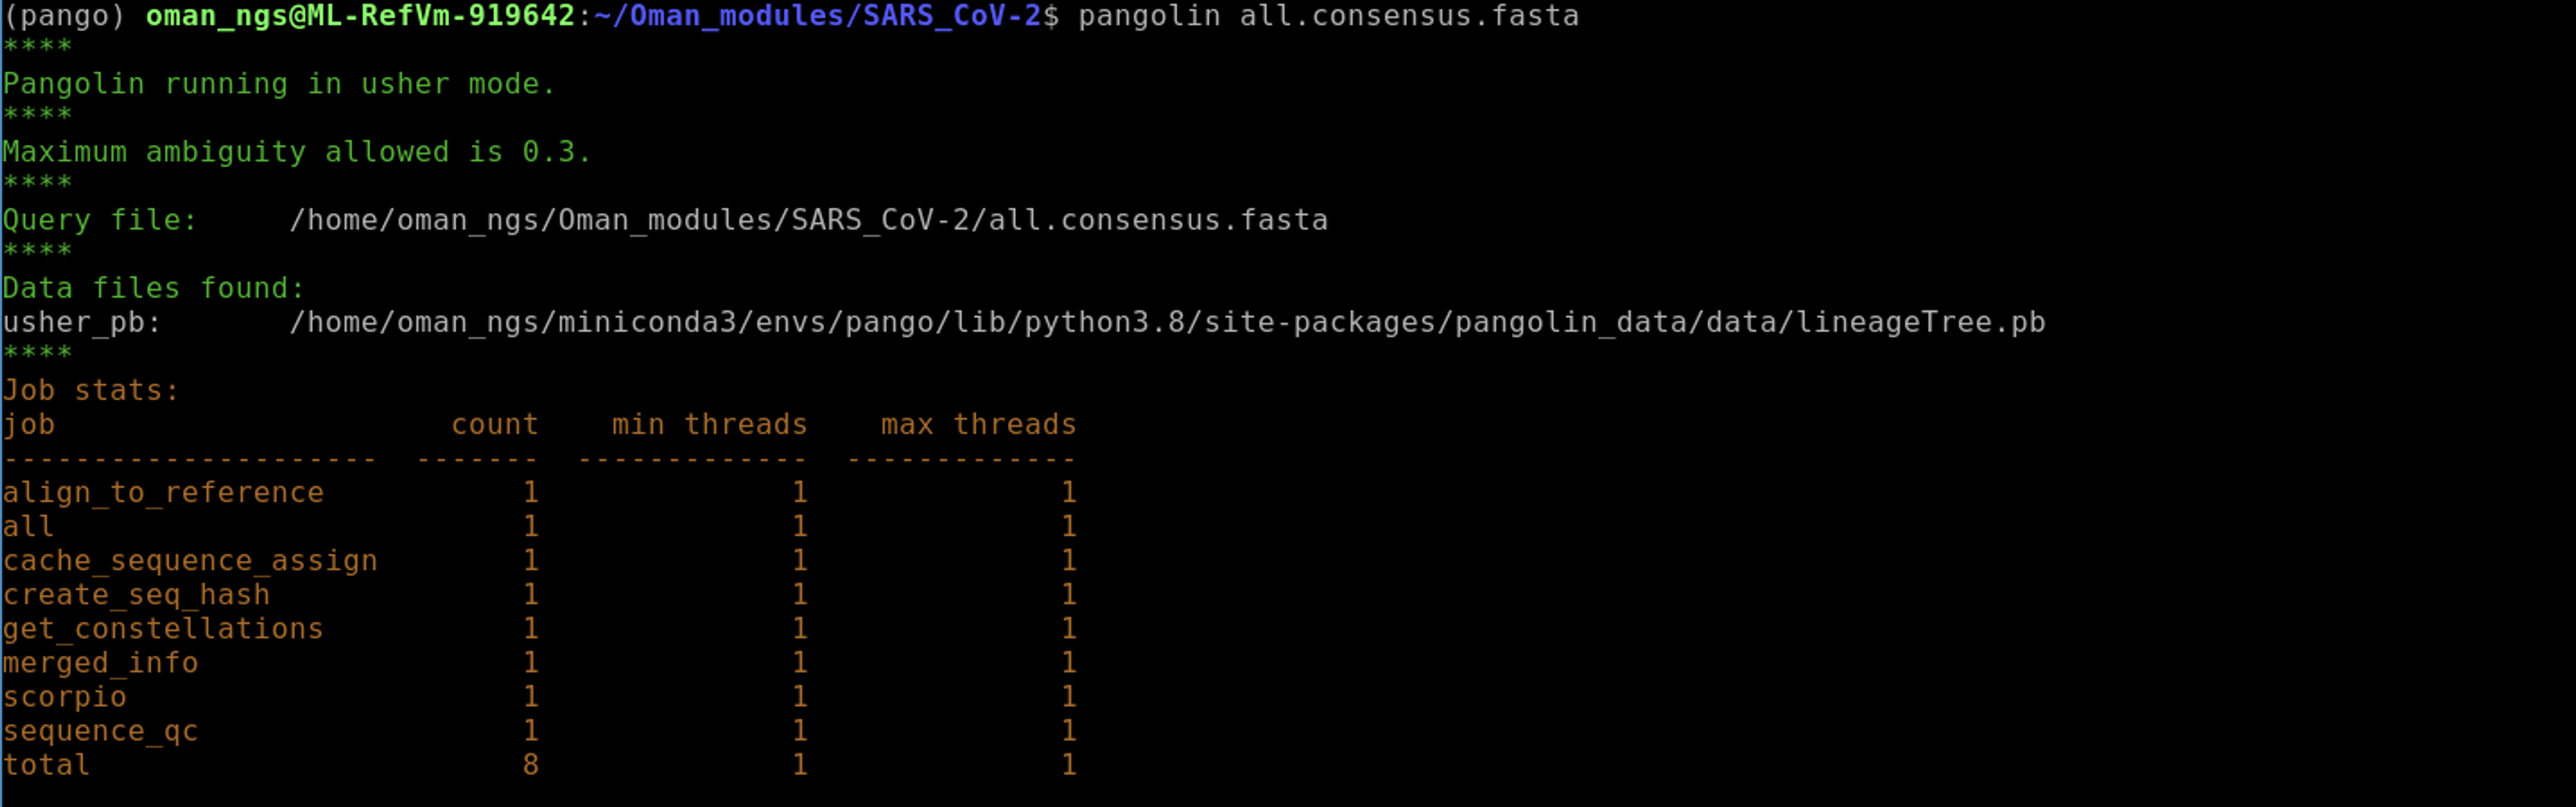
The output file created by pangolin is called lineage_report.csv.
You can view it using less:
less lineage_report.csv
To exit less type q when you are finished reading.
The descriptions of the output can be found here: https://cov-lineages.org/resources/pangolin/output.html
As there are many columns in the lineage_report.csv file it is hard to interpret the file using the less command. We can use a few tricks to help us see the output more clearly:
Recall that we can link commands together using a pipe |
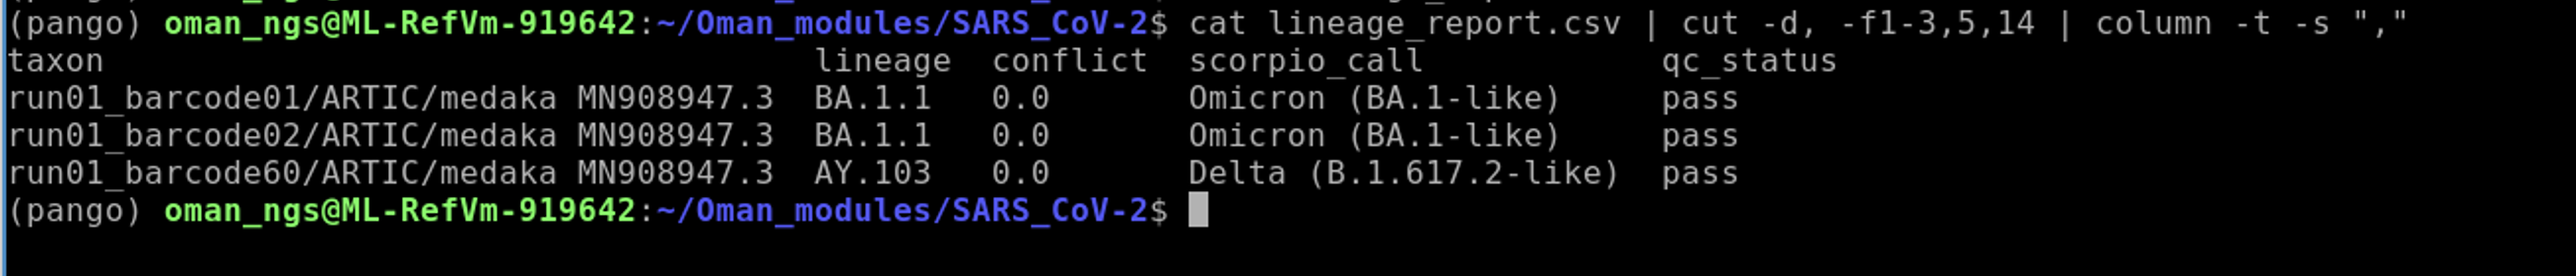
cat lineage_report.csv | cut -d, -f1-3,5,14 | column -t -s ","
cat: prints file to the screencut: command used to select which columns.-dsets the delimiter. In our case it is a,.-fsets the column numbers we wish to keep. Here we select 1 through 3,5, and 14.columnused so that it prints the output nicely aligned.-tmeans tab separate.-ssets the delimiter. Here again we set this as","
You can try these commands one at a time and see what the output is doing at each step.
Much better!
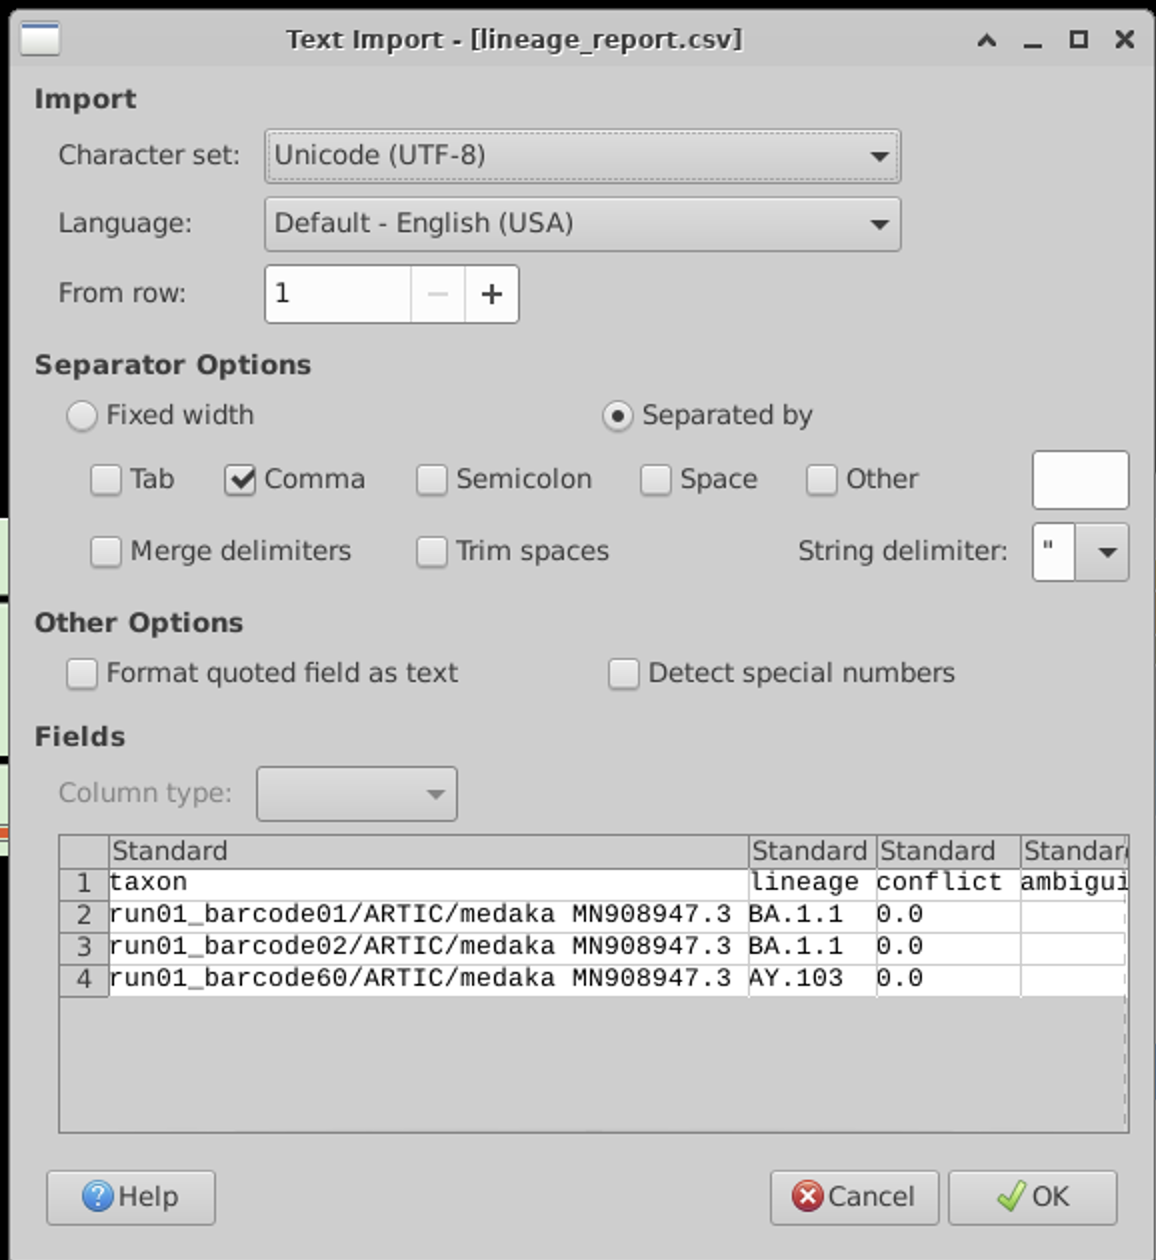
Of course, you can also read the lineage_report.csv into Excel or the equivalent in Linux, which is LibreOffice Calc.
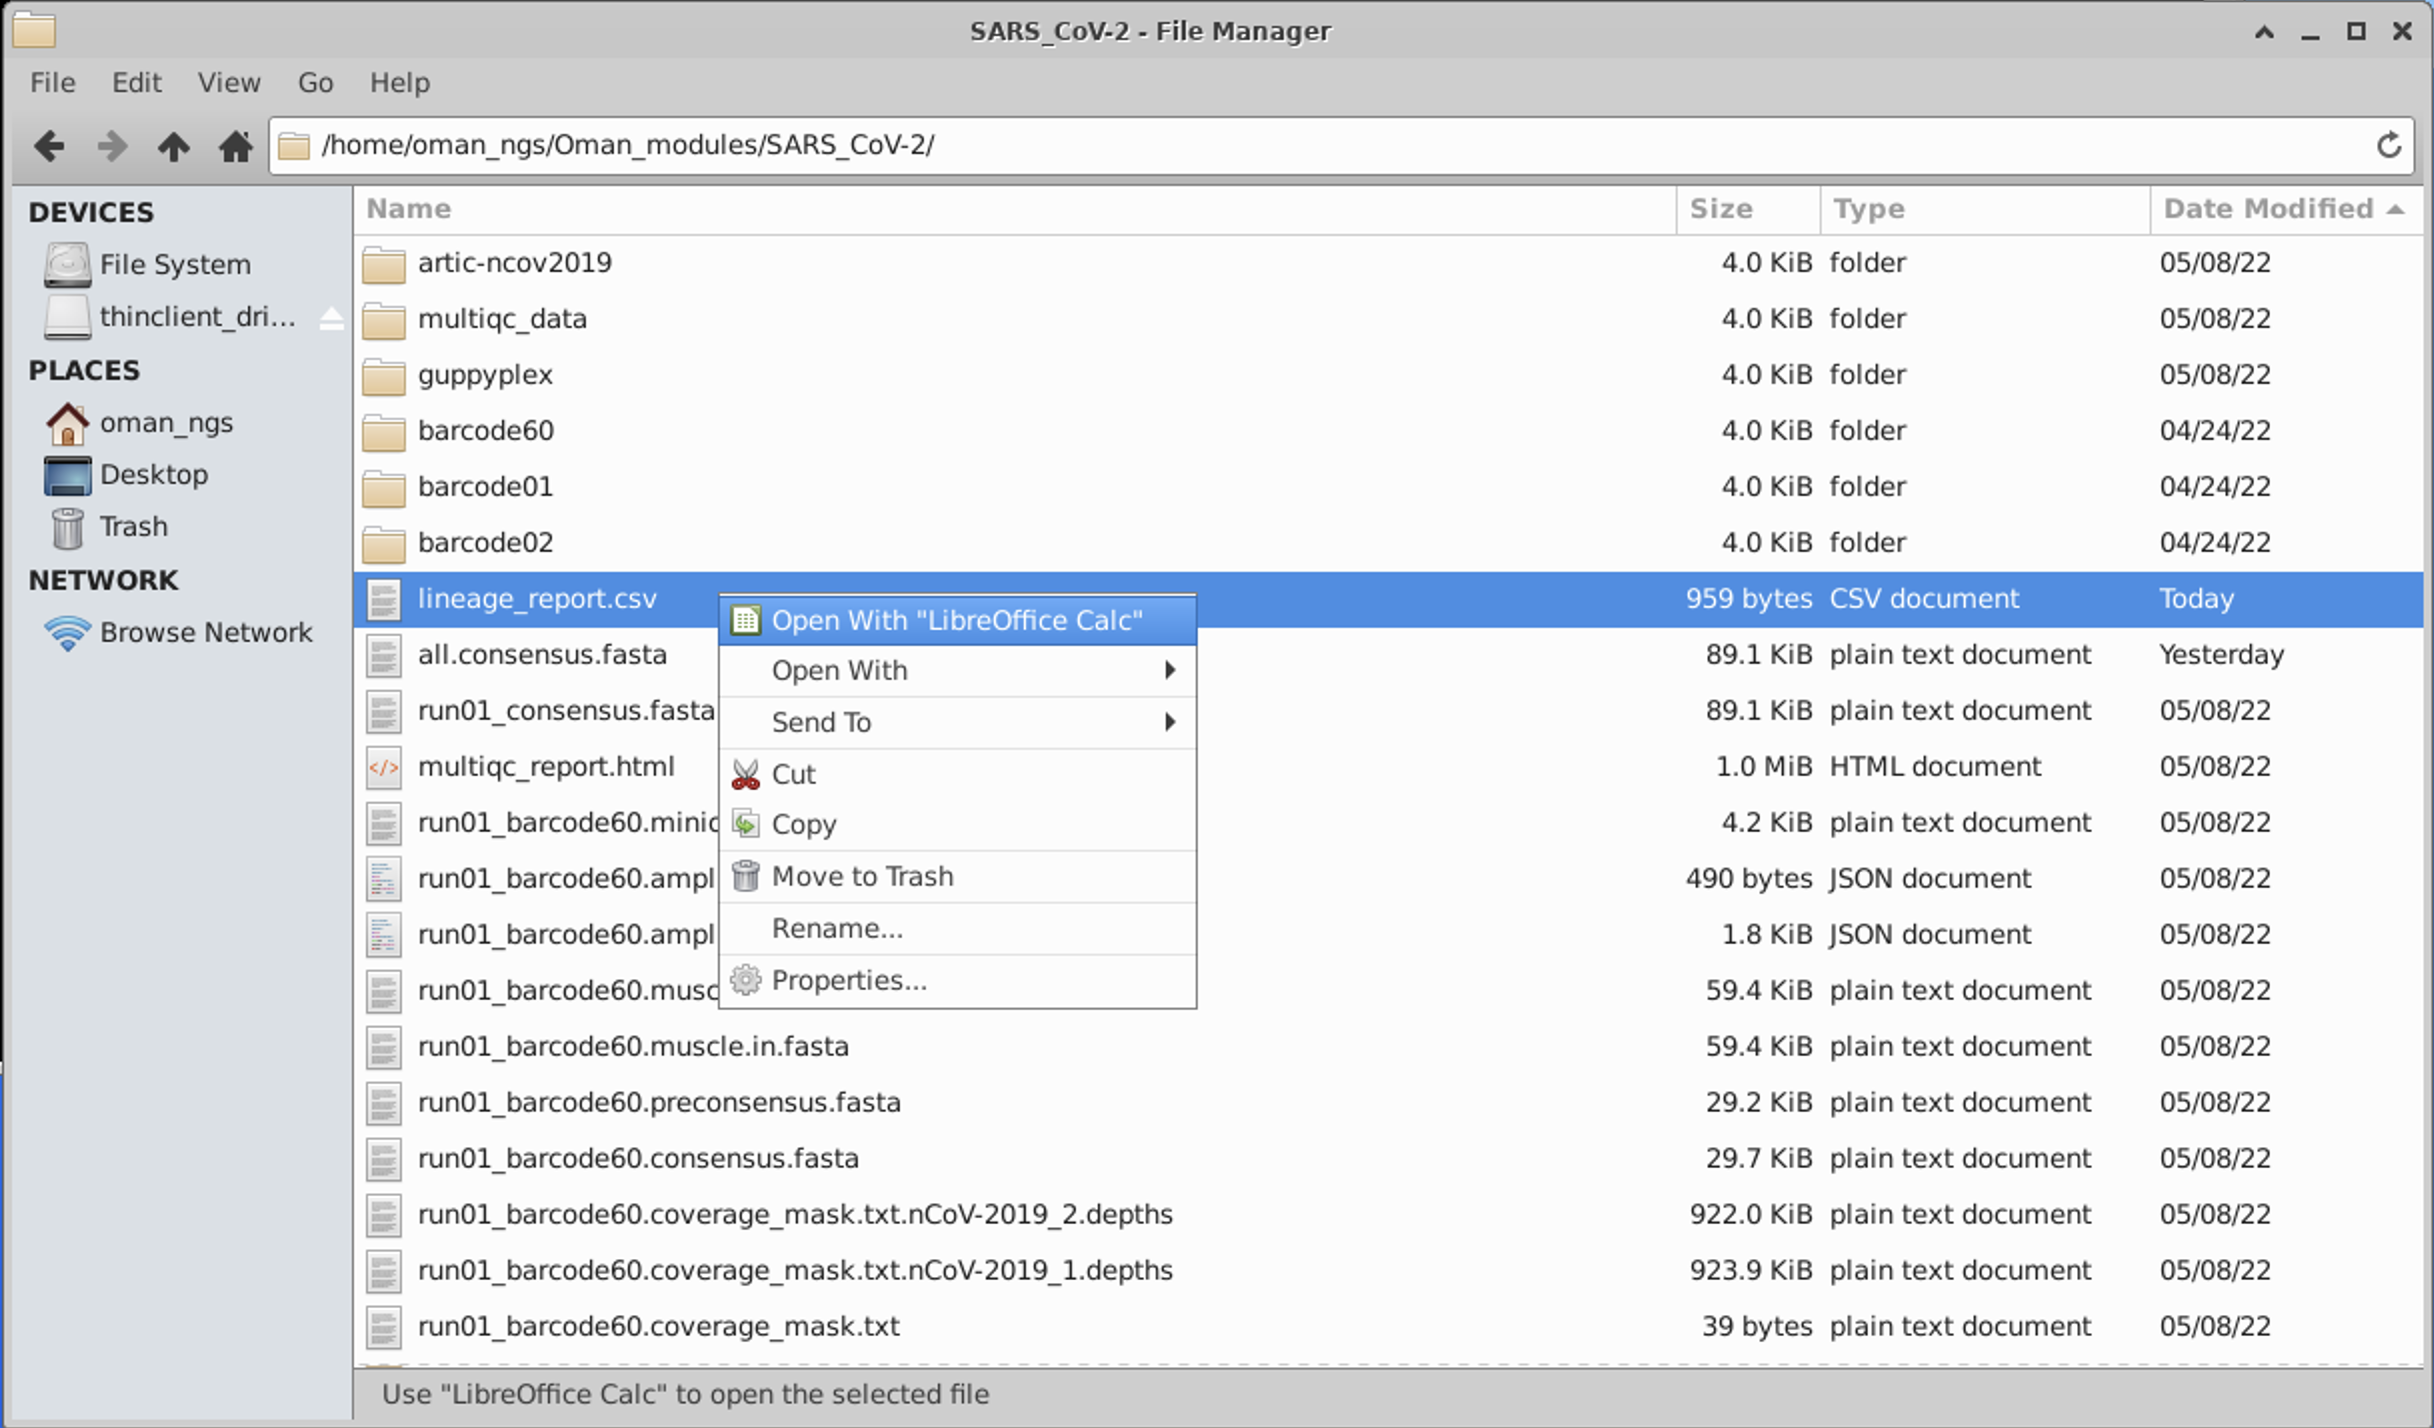
We have a comma separated file, so set the import options accordingly:
2. Running NextClade
NextClade is another popular tool for lineage calling and QC. In fact, we used the web-based version of NextClade in our first module, if you remember: https://domman-genomics.github.io/Oman_NGS/manuals/01_Intro_to_NGS/module_Intro.html
Here we are going to use the command-line version. You can learn more about the tool here: https://docs.nextstrain.org/projects/nextclade/en/stable/user/nextclade-cli.html
Install NextClade using mamba:
mamba install -c bioconda nextclade
We can install NextClade directly in our pango conda envirionment. These tools play nice with each other!
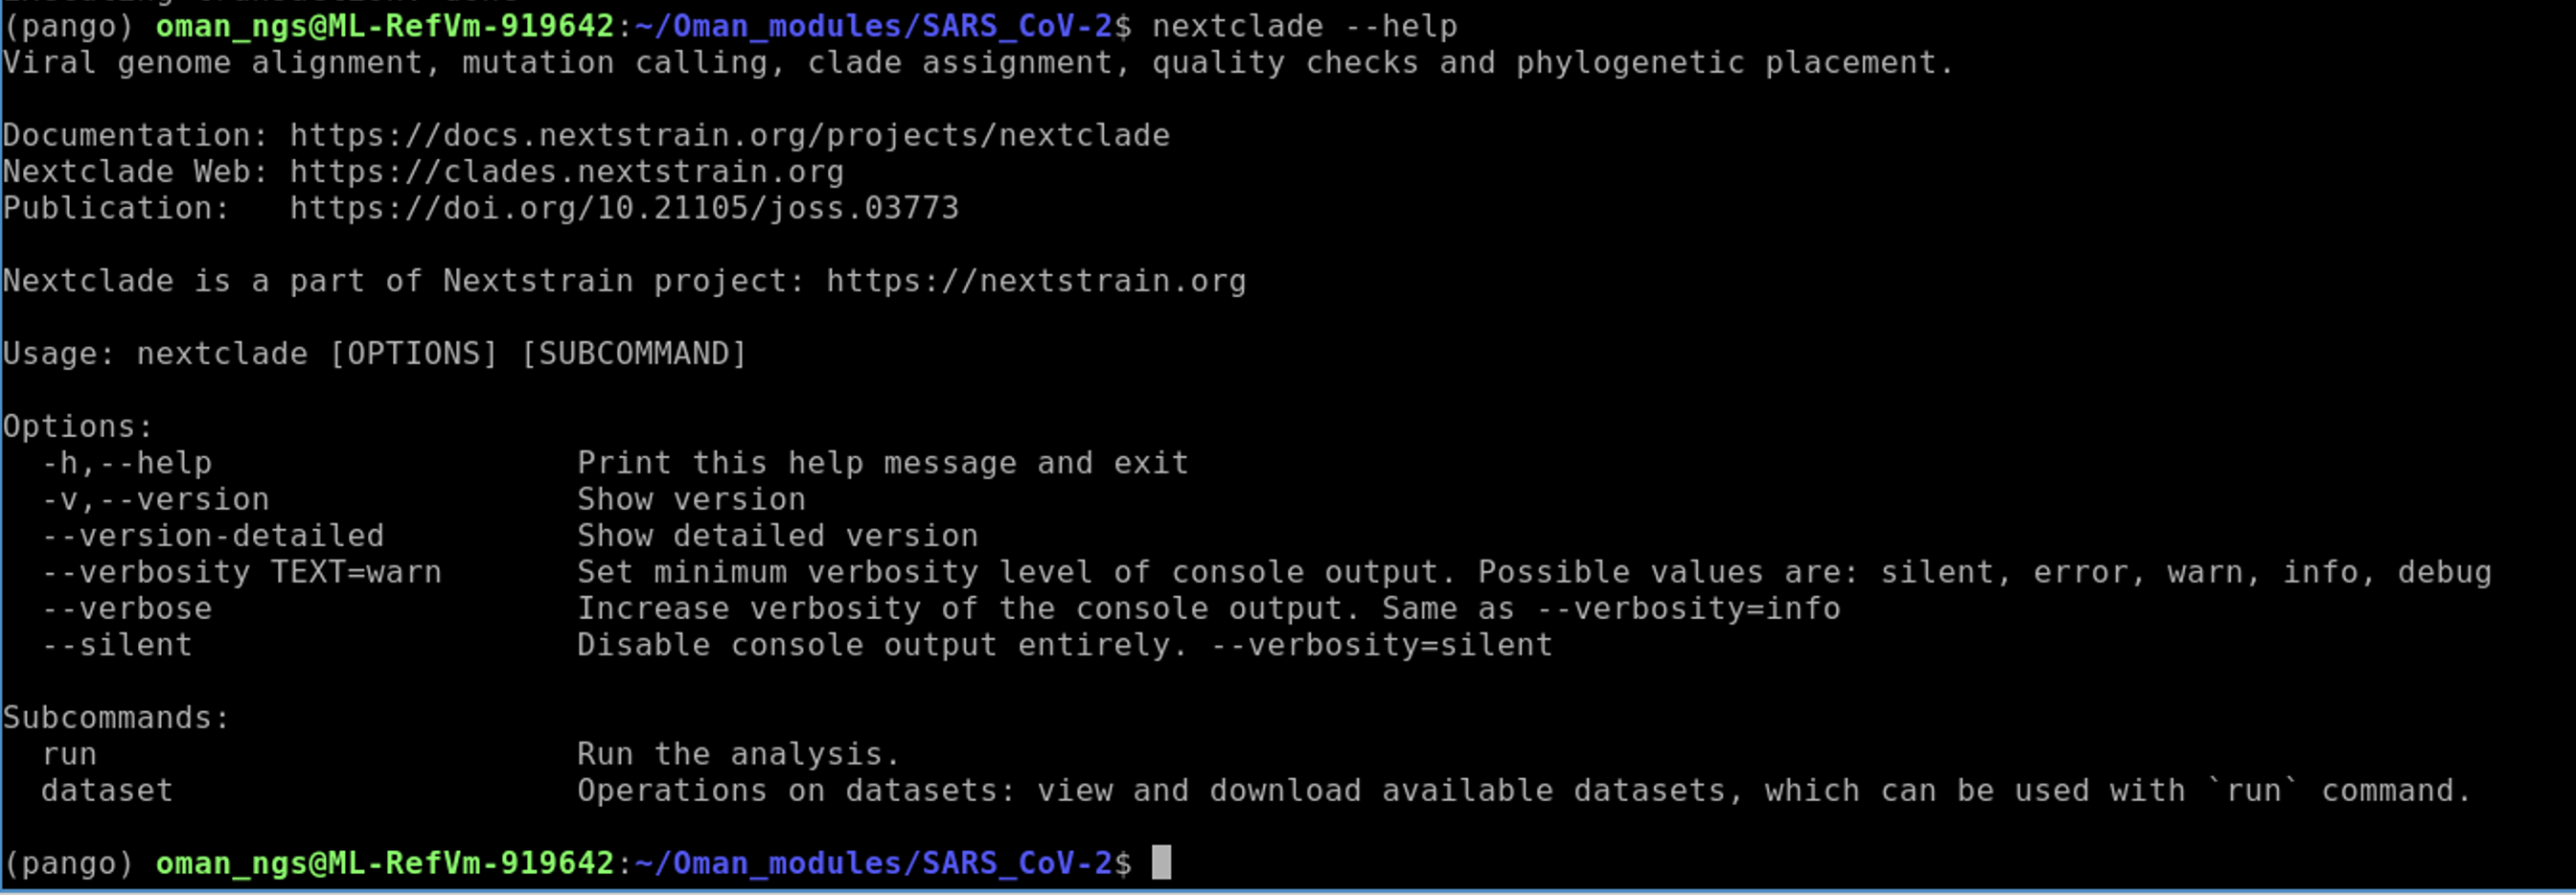
We can check it installed correctly and learn how to use the tool:
nextclade --help
Download the NextClade SARS-CoV-2 dataset
nextclade dataset get --name 'sars-cov-2' --output-dir 'data/sars-cov-2'
Now we are ready to run the analysis:
nextclade \
   --in-order \
   --input-fasta all.consensus.fasta \
   --input-dataset data/sars-cov-2 \
   --output-tsv output/nextclade.tsv \
   --output-tree output/nextclade.auspice.json \
   --output-dir output/ \
   --output-basename nextclade
The --input-fasta flag is where we specify our input fasta file. We do not need to change the other options.
The output of the command we specified will be placed in a new folder called output, using the --output-dir flag.
Viewing the results of NextClade
I think it is easiest to view this using Excel or equivalent. Open it as we did the pango results.
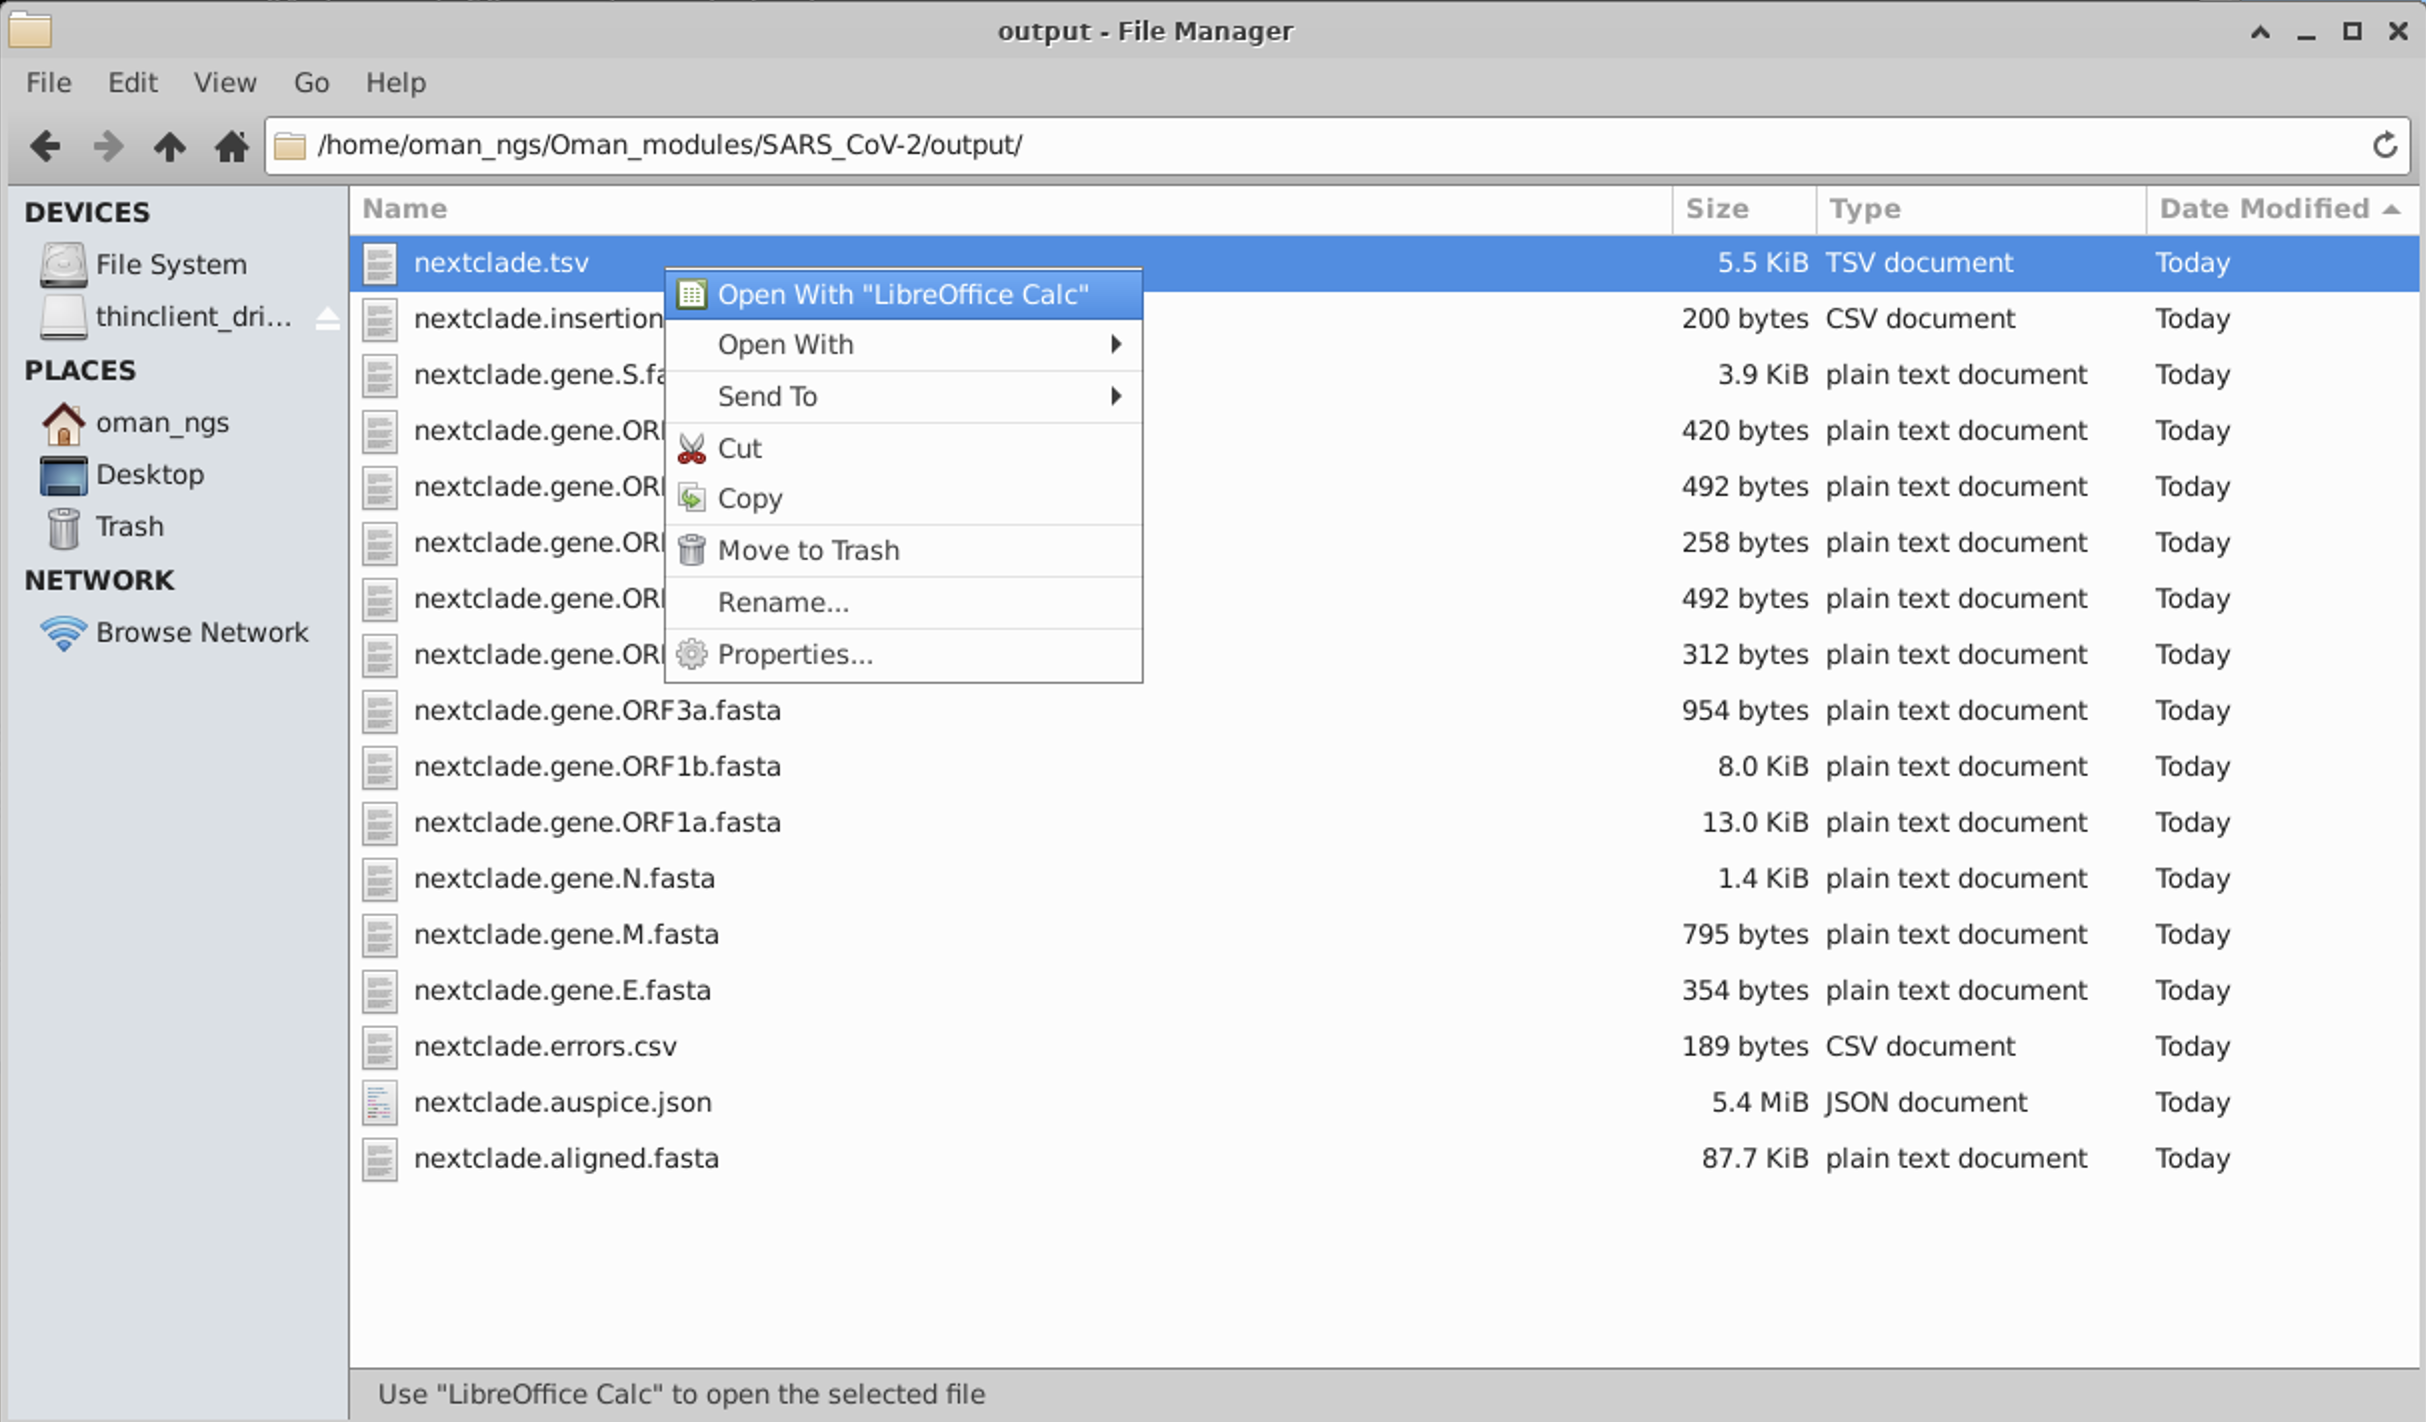
This is a tab separated file:
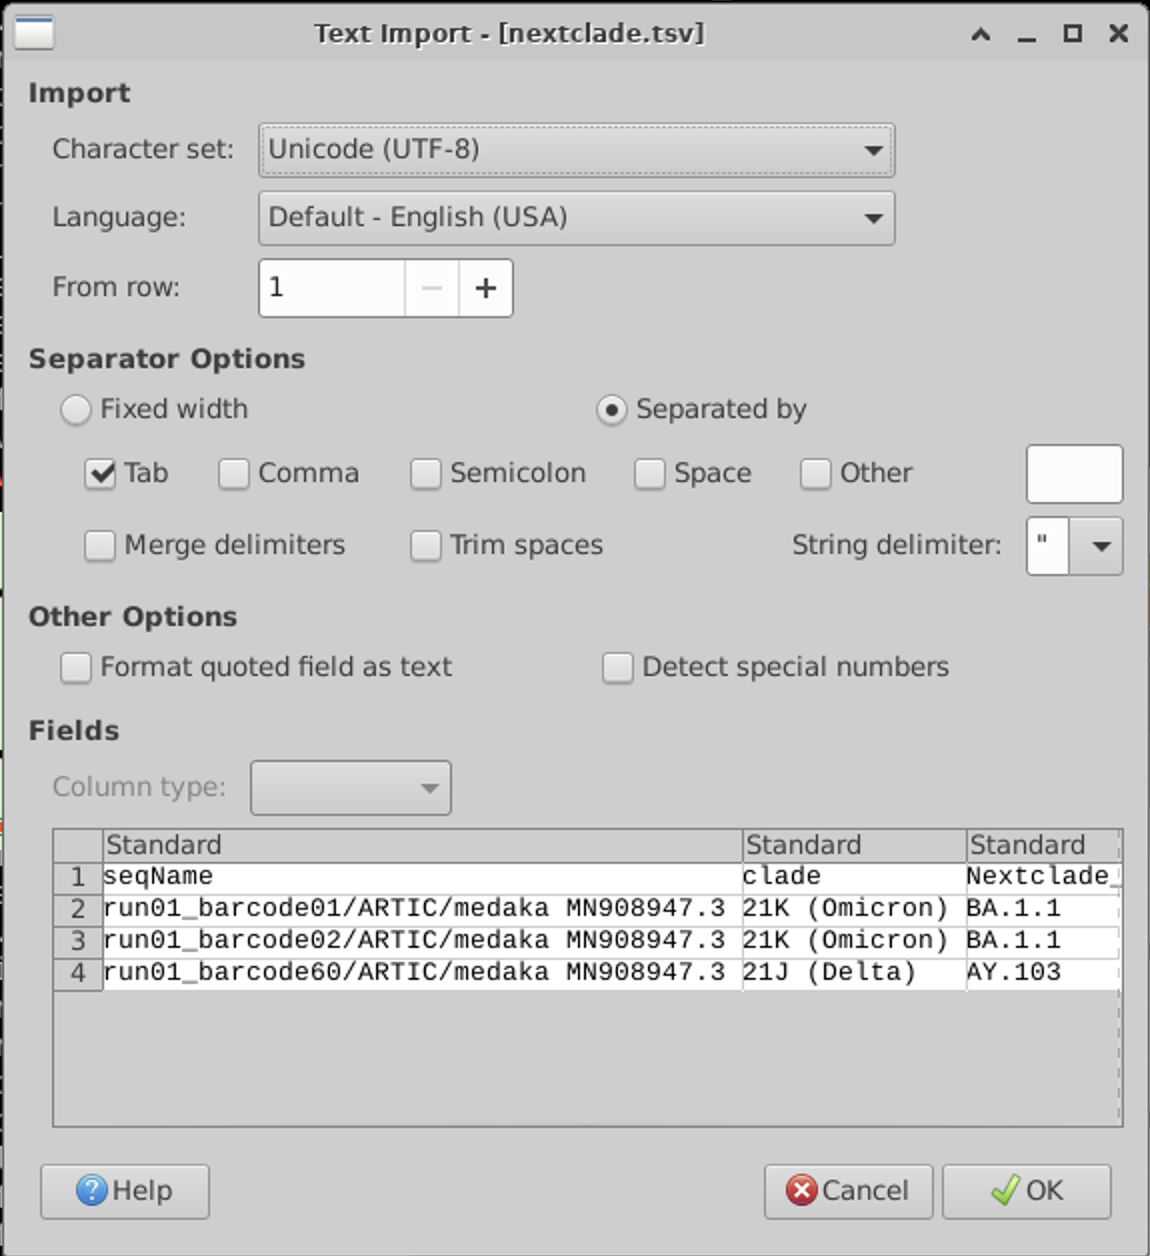
There are quote a few output columns. You can see all of the output descriptions from the website: https://docs.nextstrain.org/projects/nextclade/en/stable/user/output-files.html
But here are a few important ones:
| Column name | Meaning |
|---|---|
| seqName | Name of the sequence (as provided in the input file) |
| clade | Assigned clade |
| qc.overallScore | Overall quality control score |
| qc.overallStatus | Overall quality control status |
| totalSubstitutions | Total number of detected nucleotide substitutions |
| totalDeletions | Total number of detected nucleotide deletions |
| totalInsertions | Total number of detected nucleotide insertions |
| totalAminoacidSubstitutions | Total number of detected aminoacid substitutions |
| totalAminoacidDeletions | Total number of detected aminoacid deletions |
| totalMissing | Total number of detected missing nucleotides |
| totalNonACGTNs | Total number of detected ambiguous nucleotides |
| totalPcrPrimerChanges | Total number of nucleotide mutations detected in PCR primer regions |
| substitutions | List of detected nucleotide substitutions |
| deletions | List of detected nucleotide deletion ranges |
| insertions | List of detected inserted nucleotide fragments |
3. Align sequences using mafft
The next step is to place our sequences within context of other globally representative strains. But before we can create a phylogeny, we have to ensure our sequences are aligned. We will be using the mafft aligner for this.
We will also download a tool that allows you to visualize our sequence and alignment data.
Install jalview
mamba install -c conda-forge -c bioconda jalview
First lets copy over the representative set from the NextClade data folder we downloaded earlier:
cp data/sars-cov-2/sequences.fasta .
Now we need to add our samples to this set. Let’s use the cat command to merge these two files.
cat all.consensus.fasta sequences.fasta > combined_seqs.fasta
Use grep to count how many sequences we have total in the alignment now:
grep -c '>' combined_seqs.fasta
Now we align the sequences with mafft like so:
mafft --thread 4 combined_seqs.fasta > combined_seqs_ALN.fasta
mafft [options] in_file > out_file
--thread : number of CPUs to use (we have 4 on the VM)
We can look at the alignment using jalview:
jalview -open combined_seqs_ALN.fasta
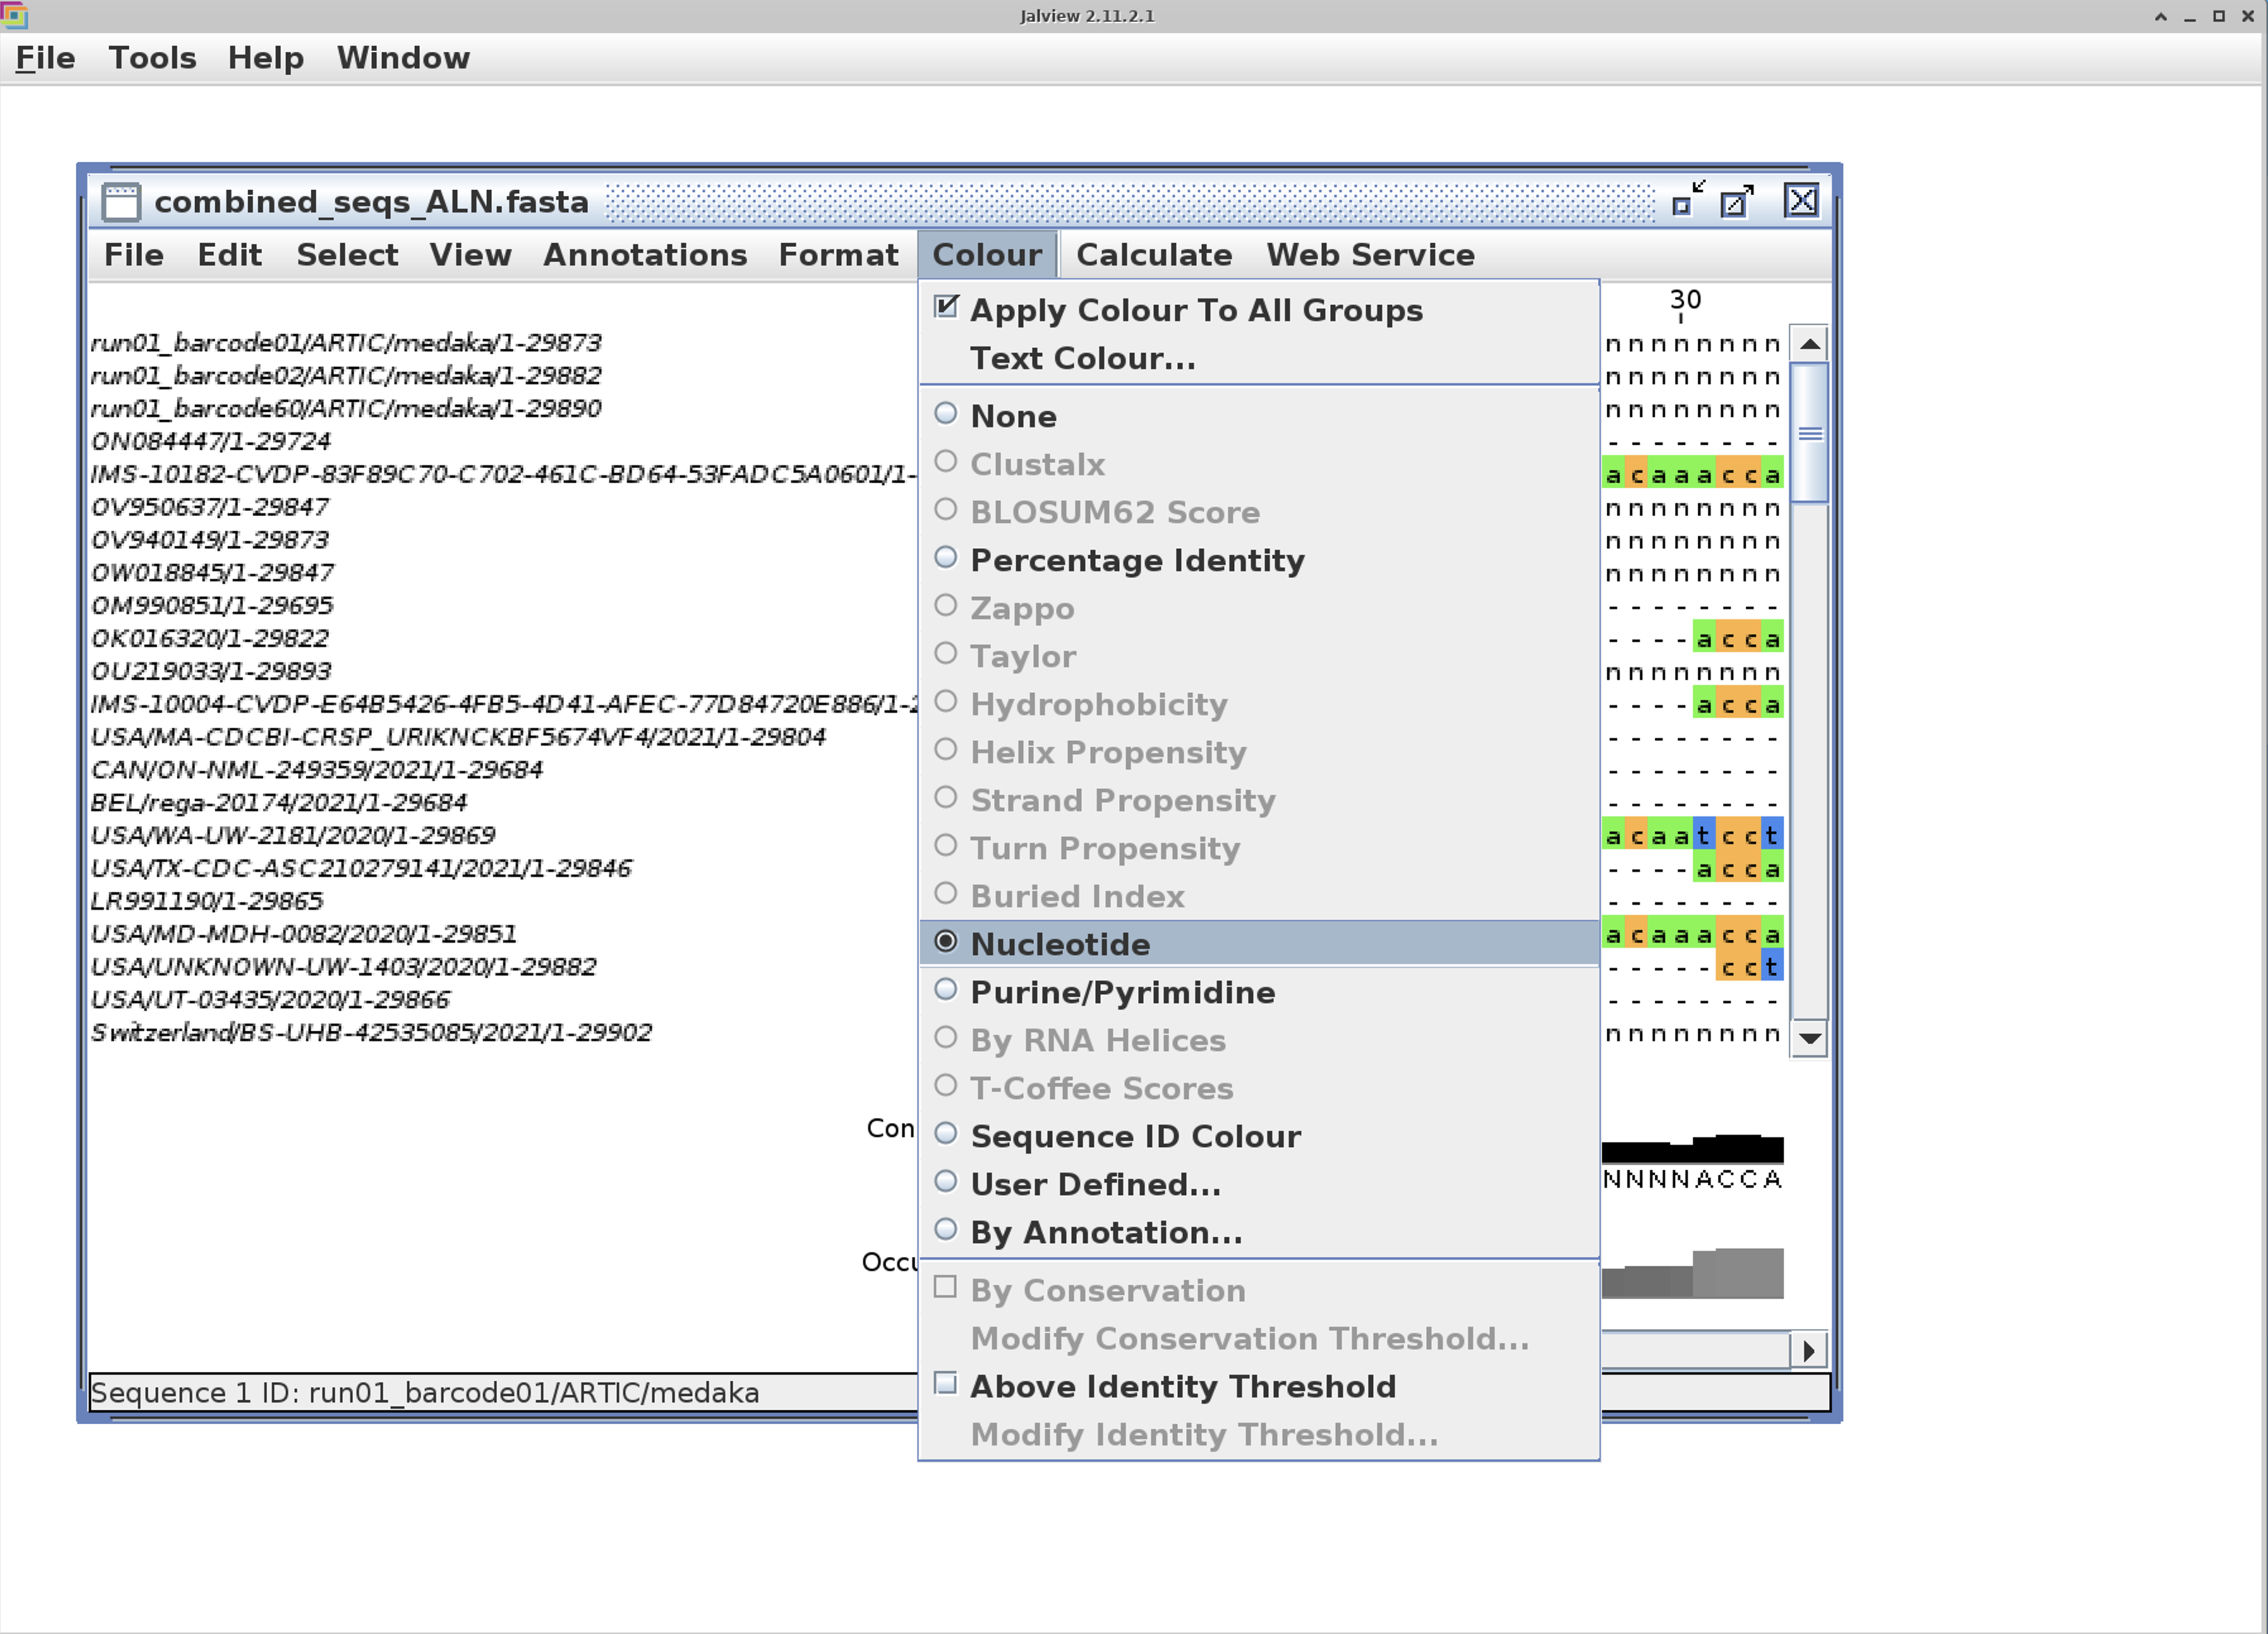
I find that turning on the color option to “Nucleotide” makes the alignment much easier to view.
4. Phylogeny using IQ-Tree
There are many different programs used for creating phylogenies:
- RAxML
- IQ-Tree
- PhyML
- FastTree
- BEAST
- PhyloBayes
Today we will use a widely popular one called IQ-Tree. You can find more information about the programs and it’s many options here: http://www.iqtree.org
First we need to install iqtree:
mamba install -c conda-forge -c bioconda iqtree
We can create a phylogeny using this command:
iqtree -s combined_seqs_ALN.fasta -m GTR -T AUTO -B 1000
-s: input sequence alignment
-m : model of evolution. The general time reversible model (GTR) is usually a good choice.
-T : number of CPUs. IQ-Tree can auto find the optimal number with AUTO
-B: number of rapid bootstraps to assess statistical confidence in branch support
There are several outputs from iqtree:
.iqtree : the main report file that is self-readable. You should look at this file to see the computational results.
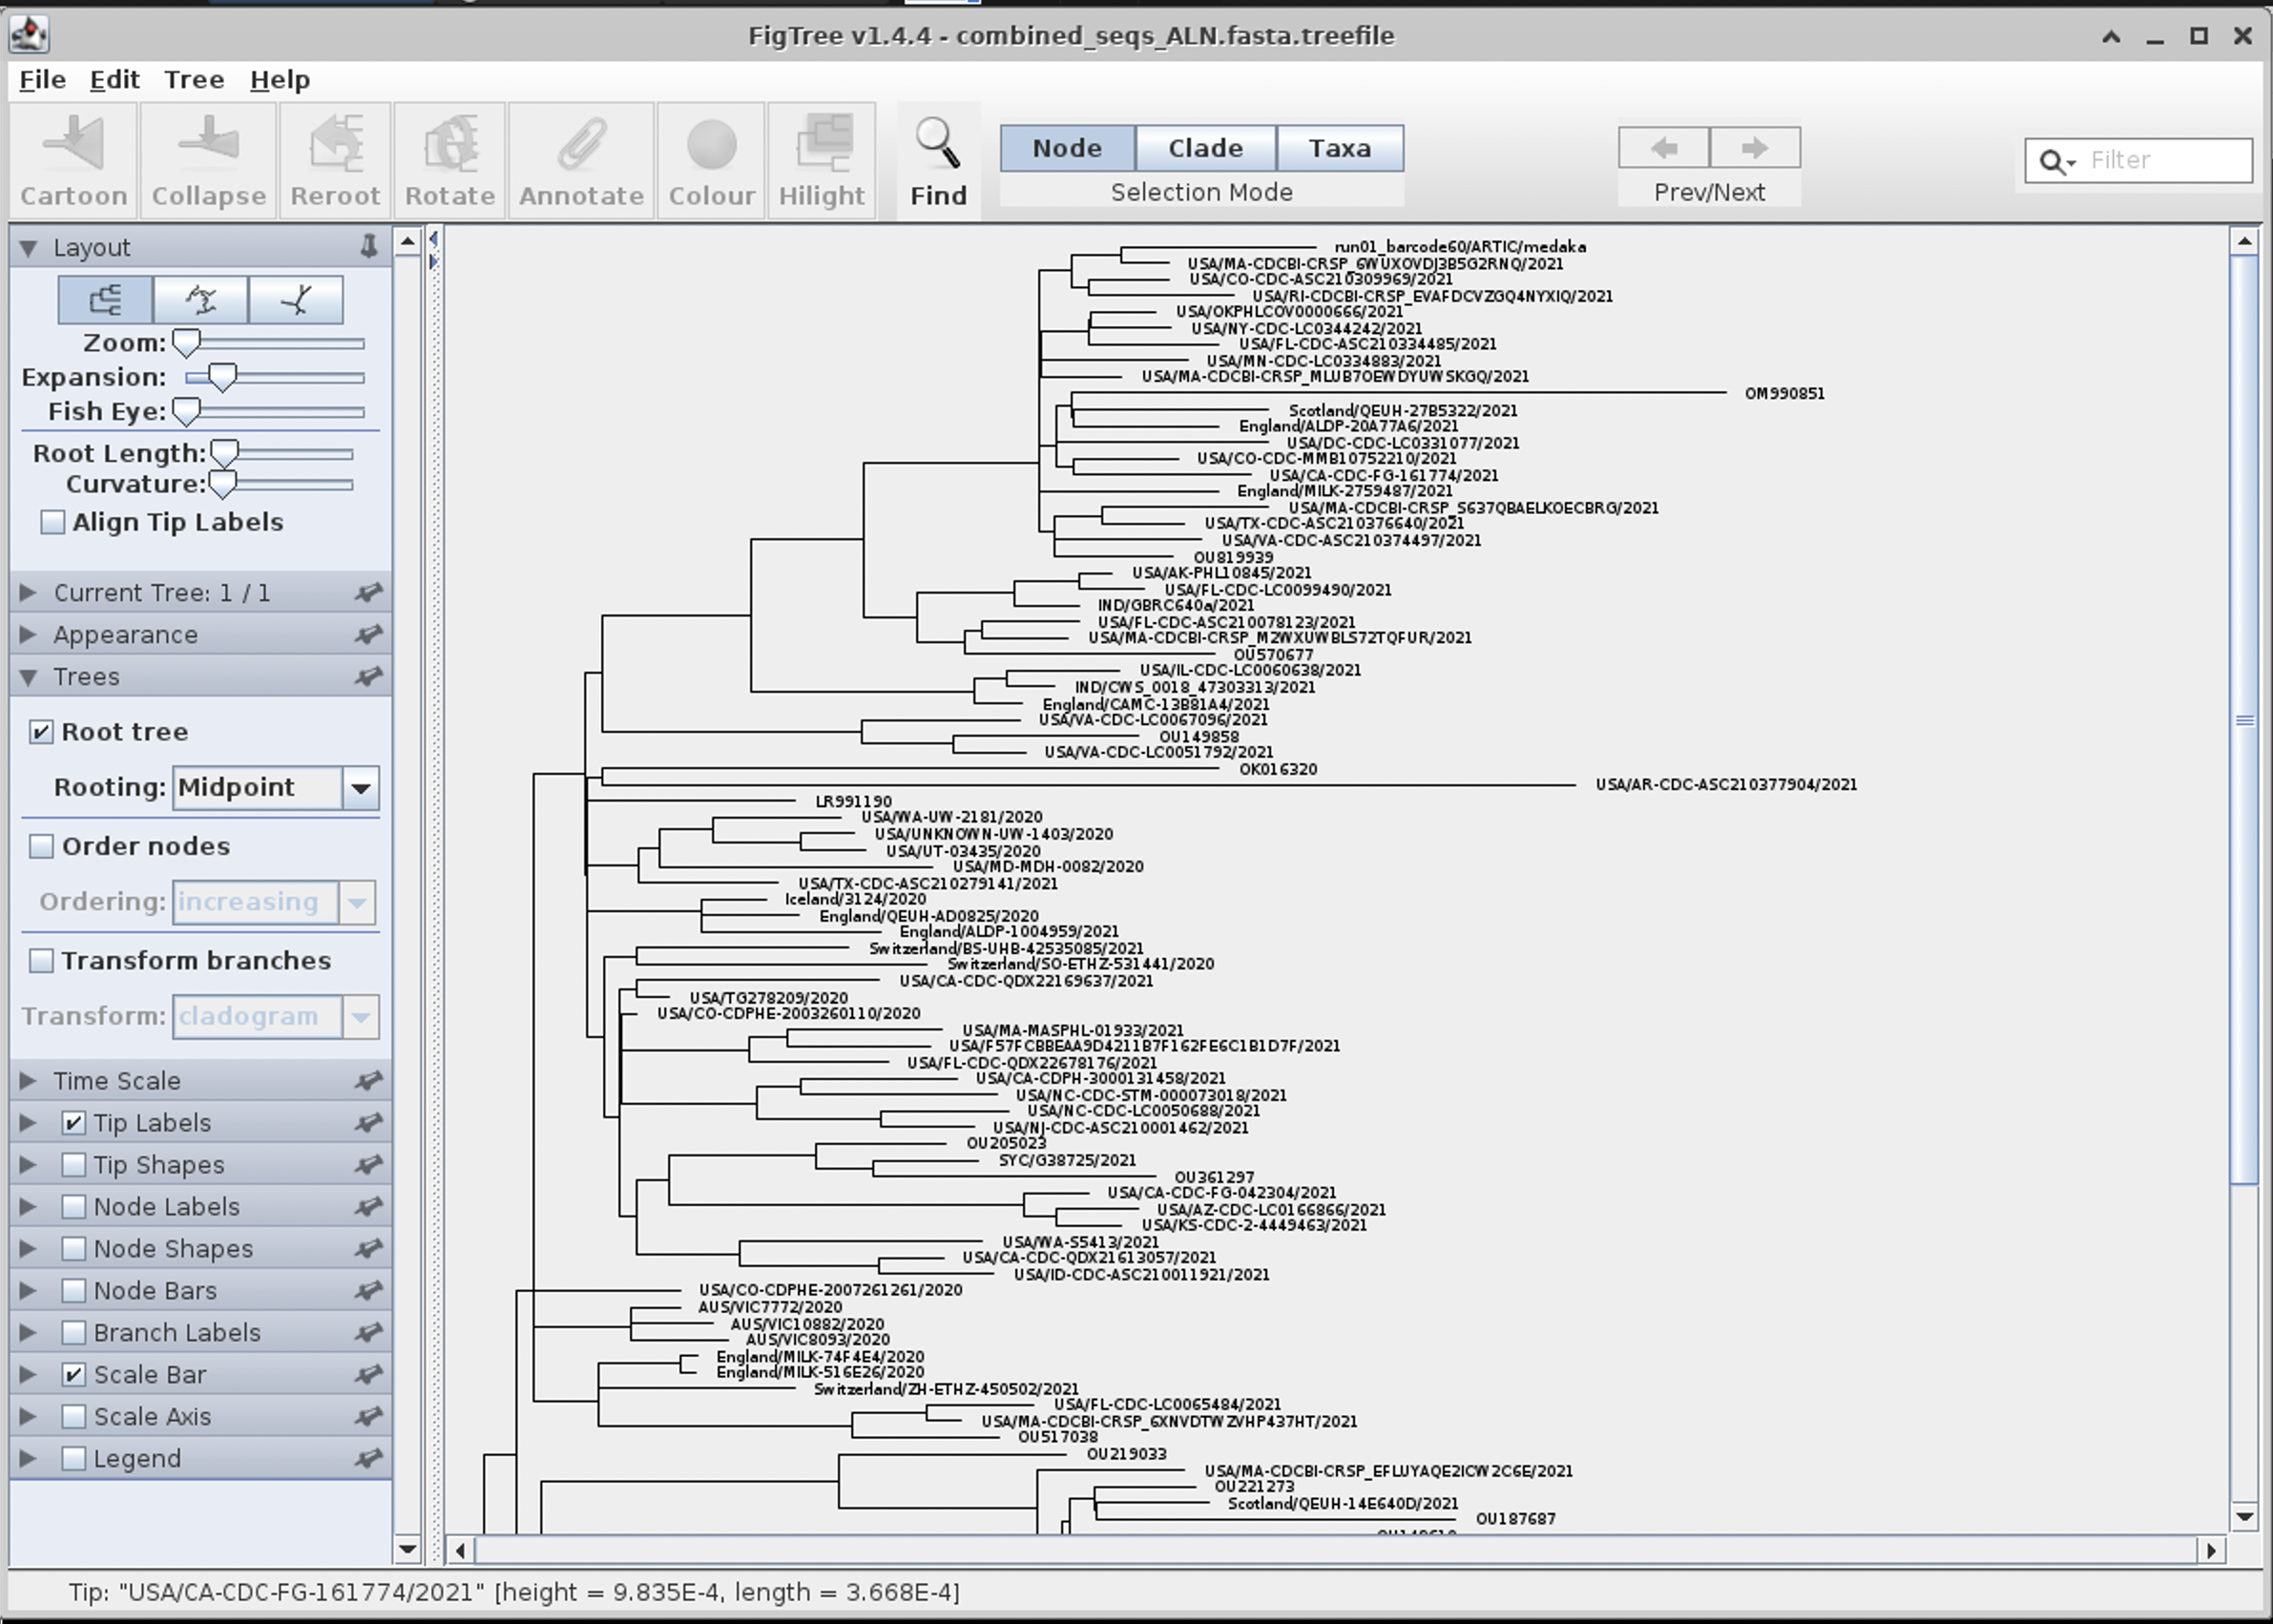
.treefile : the ML tree in NEWICK format, which can be visualized by FigTree or iTOL
.log: log file of the entire run
We need to install figtree to view the phylogeny.
mamba install -c conda-forge -c bioconda figtree
Once installed lauch figree to view out tree:
figtree combined_seqs_ALN.fasta.treefile
Click OK when the popup menu appears.
We can then re-root the tree like so for better viewing by selecting Midpoint root in the left hand menu: